Product: ABAQUS/Standard
This example illustrates the use of detailed finite element bushing models to generate constitutive data for BUSHING connector elements (see “Connection-type library,” Section 25.1.5 of the ABAQUS Analysis User's Manual) when experimental data for a particular bushing design are not available. The technique is helpful in reducing the complexity and size of models. For an automotive bushing the fully discretized bushing can be replaced with a very inexpensive 2-node connector element to reduce computational costs while accurately capturing the macroscopic response of the bushing. The nonlinear constitutive data that are generated for the connectors are used to model the constitutive behavior of bushings in an automobile suspension lower control arm.
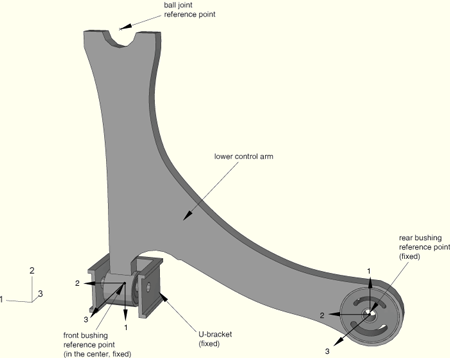
The geometry of the suspension lower control arm (LCA) is shown in Figure 3.2.4–1. Since the main focus of this example is to illustrate modeling of the bushings, a simplified representation of the LCA is used. The global 1-direction is aligned with the car's axis, the global 2-direction is located in a horizontal plane and points toward the exterior of the car, while the global 3-direction is vertical. The LCA is connected to the car subframe (assumed fixed in space) via the front and rear bushings. A ball joint (not shown) connects the LCA to the wheel assembly. The LCA is a steel shell structure and is modeled as a linear elastic material with a Young's modulus of 2.1 × 10⁵ MPa and a Poisson's ratio of 0.3.
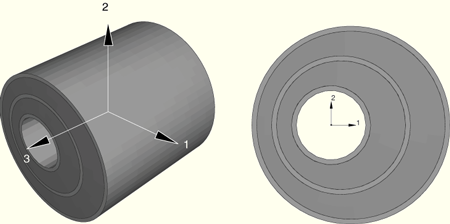
As shown in Figure 3.2.4–2, the rear bushing modeled is a hollow cylinder with a rubber portion enclosed between two (inner and outer) thin steel tubes. The rubber part has two symmetrically placed cutouts of different sizes, and it is rigidly bonded to the steel tubes. The steel tubes are 2 mm thick and are modeled as a linear elastic material with a Young's modulus of 2.1 × 10⁵ MPa and a Poisson's ratio of 0.3. The inner diameter of the bushing is 28 mm, the outer diameter is 72 mm, and the axial length of the bushing is 20 mm. The bushing axis is aligned along the global 3-direction. The outer steel tube and the inner steel tube are each connected to a reference node using a distributing coupling. These reference nodes are used to connect the outer steel tube to the LCA and the inner tube to the subframe. The rubber is modeled as a second-order Ogden hyperelastic material (“Hyperelastic behavior of rubberlike materials,” Section 17.5.1 of the ABAQUS Analysis User's Manual), which may undergo nonlinear, finite deformation. The material parameters are ![]() = 1.671,
= 1.671, ![]() = 9.0067,
= 9.0067, ![]() = 2.154E–4,
= 2.154E–4, ![]() = –4.86970,
= –4.86970, ![]() = 1.0, and
= 1.0, and ![]() = 1.0.
= 1.0.
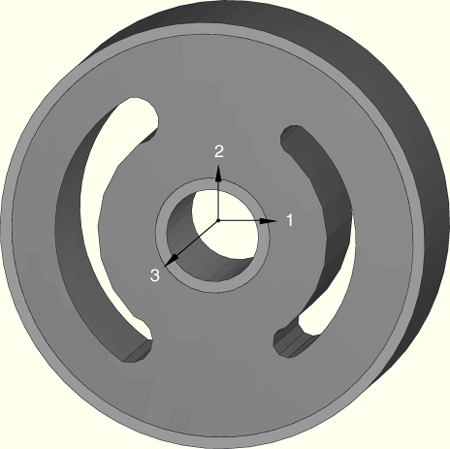
The geometry of the front bushing is shown in Figure 3.2.4–3; it consists of three noncoaxial steel tubes with two rubber parts between them. The axial length of the bushing is 40 mm, and the bushing axis is aligned along the global 3-direction. The outer diameters of the three tubes are 40 mm, 28 mm, and 16 mm. All three tubes have a thickness of 1 mm. The outer steel tube and the inner steel tube are each connected to a reference node using a distributing coupling. The reference nodes are used to connect the outer tube to the LCA and the inner tube to the U-shaped bracket (rigidly attached to the subframe). The reference nodes are positioned at mid-length on the axis of the inner tube. The steel tubes are modeled as a linear elastic material with a Young's modulus of 2.1E5 MPa and a Poisson's ratio of 0.3. The rubber is modeled as a second-order Ogden hyperelastic material. The material parameters are ![]() = 0.1671,
= 0.1671, ![]() = 9.0067,
= 9.0067, ![]() = 2.154E–5,
= 2.154E–5, ![]() = –4.8694,
= –4.8694, ![]() = 0.1, and
= 0.1, and ![]() = 0.1. Depending on the application, strain energy potentials should be chosen that best fit the rubber material behavior.
= 0.1. Depending on the application, strain energy potentials should be chosen that best fit the rubber material behavior.
To generate the nonlinear constitutive data for each bushing, a series of geometrically nonlinear, quasi-static analyses are performed. In all cases the reference node of the distributing coupling connected to the outer steel tube is held fixed in all degrees of freedom, while the second reference node connected to the inner tube moves. A BUSHING connector for which no constitutive behavior is defined is placed between the two reference nodes. The use of a BUSHING connector to drive the deformation in these models is desirable since this choice ensures appropriate kinetic modeling when the connector is used in other models (such as a full-vehicle analysis). Both connector element orientations are aligned initially with the global system. Since the main interest is capturing the hyperelastic response of the rubber bushings, both unidirectional and coupled multidirectional tests (simultaneous deformations in two directions) are performed as summarized below. Furthermore, in all cases where contact interactions are specified between the components, the surface-to-surface contact formulation in ABAQUS/Standard is used.
To analyze several bushing loading conditions, some connector components of relative motion can be fixed and others can be prescribed nonzero motion. The reaction forces and relative motions in the connector are saved as history output. The data from these analyses are then used in a subsequent analysis (e.g., full-vehicle analysis) to define nonlinear connector elasticity data.
To generate the data, static analyses are performed for each of the bushings for several loading conditions.
Test 1:
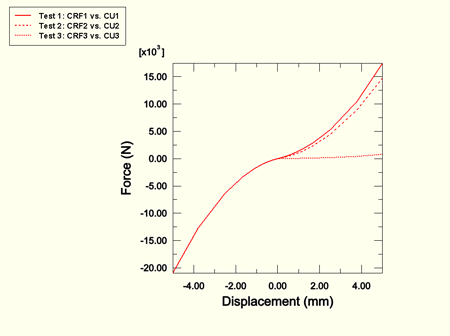
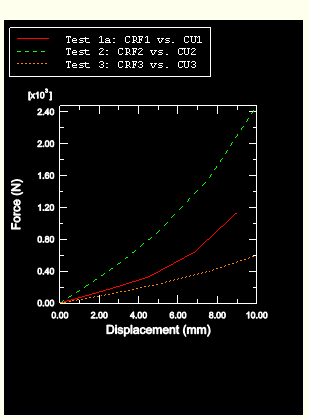
A translational motion is applied in the local 1-direction with all other relative motions fixed. The magnitude of this motion is 5 mm for the front bushing and 10 mm for the rear bushing. The CRF1 vs. CU1 data generated from this analysis are used to define nonlinear elasticity data for component 1 (see Figure 3.2.4–4 and Figure 3.2.4–7).
Test 2:
A translational motion is applied in the local 2-direction with all other relative motions fixed. The magnitude of this motion is 5 mm for the front bushing and 10 mm for the rear bushing. The CRF2 vs. CU2 data generated from this analysis are used to define nonlinear elasticity data for component 2 (see Figure 3.2.4–4 and Figure 3.2.4–7).
Test 3:
A translational motion is applied in the local 3-direction with all other relative motions fixed. The magnitude of this motion is 5 mm for the front bushing and 10 mm for the rear bushing. The CRF3 vs. CU3 data generated from this analysis are used to define nonlinear elasticity data for component 3 (see Figure 3.2.4–4 and Figure 3.2.4–7).
Test 4:
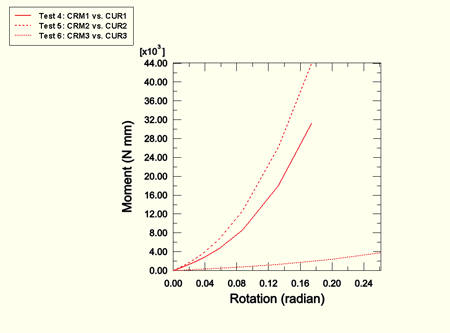
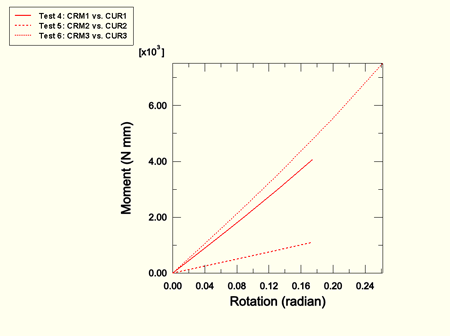
For both the front and rear bushings, a 10° “bending” rotational motion about the local 1-direction is applied with all other relative motions fixed. The CRM1 vs. CUR1 data generated from this analysis are used to define nonlinear elasticity data for component 4 (see Figure 3.2.4–5 and Figure 3.2.4–8).
Test 5:
For both the front and rear bushings, a 10° “bending” rotational motion about the local 2-direction is applied with all other relative motions fixed. The CRM2 vs. CUR2 data generated from this analysis are used to define nonlinear elasticity data for component 5 (see Figure 3.2.4–5 and Figure 3.2.4–8).
Test 6:
For both the front and rear bushings, a 15° “twisting” rotational motion about the local 3-direction is applied with all other relative motions fixed. The CRM3 vs. CUR3 data generated from this analysis are used to define nonlinear elasticity data for component 6 (see Figure 3.2.4–5 and Figure 3.2.4–8).
Test 7 (front bushing):
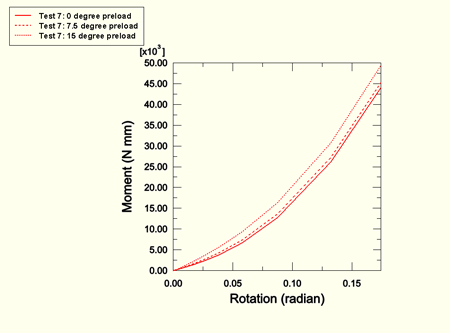
For the front bushing only, a 10° bending motion about the local 2-direction is applied about two preloaded configurations. The test attempts to capture coupling effects in the bushing after complex deformation is achieved. The preloaded configurations are:
A twisting of 7.5º about the local 3-direction.
A twisting of 15º about the local 3-direction.
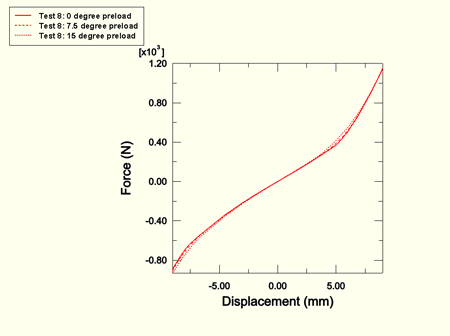
Test 8 (rear bushing):
For the rear bushing only, a 10 mm translational motion is applied in the local 1-direction about two preloaded configurations. The preloaded configurations are:
A bending of 7.5º about the local 2-direction.
A bending of 15º about the local 2-direction.
The analyses chosen above are deemed appropriate to generate the necessary and complete nonlinear elasticity data for the BUSHING connector. The quasi-static analyses were run over sufficiently large motion ranges to cover the motion range expected in the analysis where the BUSHING connector is used. Nonlinear elasticity data are generated in all six relative directions in the BUSHING connector. For each of the bushings, elasticity data are generated (Tests 7 and 8) for one coupled deformation mode that was thought to be the dominant coupling mode in the subsequent analysis where the BUSHING connectors are used. In general, the number and complexity of coupled deformation tests can be increased to match your modeling needs.
Three different models are created for the analysis of the lower control arm system; a fully meshed model, a bushing connector model, and a substructure model. They all model the LCA using the front and rear bushings to connect to the car subframe (not modeled) that is assumed to be fixed in space. Loads are applied to a reference point where the ball joint is attached to model loads that the wheel assembly would exert on the LCA. The constraint is modeled in all three cases by constraining the motion of the inner cylinder distributed coupling reference node in all six degrees of freedom.
In the fully meshed model, the arm itself is modeled using shell elements, while the front and rear bushings are modeled using continuum elements. The front bushing is connected to the reference node of a U-bracket that is modeled as a rigid body (see Figure 3.2.4–1). The rigid body reference node of the U-bracket is held fixed in all six degrees of freedom.
In the bushing connector model the bushings in the fully meshed model are replaced with BUSHING connectors. The constitutive data for the connectors are obtained from the series of tests described above. The front bushing is connected to the reference node of a U-bracket that is modeled as a rigid body (see Figure 3.2.4–1). The rigid body reference node of the U-bracket is held fixed in all six degrees of freedom.
In the substructure model the lower control arm is modeled with a substructure, and the bushings are modeled with connector elements as defined in the bushing connector model. For clarity, the U-bracket is not represented in the substructure model since it is considered to be rigid and fixed. The rear bushing inner cylinder is connected to the subframe via a large bolt.
Two load cases are applied in all three models:
Load case 1:
A geometrically nonlinear, single-step, static analysis is performed where a concentrated force of 1000 N is applied at the ball joint reference node in the negative global 1-direction (along the car's direction). The analysis models a horizontal load at the ball joint.
Load case 2:
A geometrically nonlinear, two-step, static analysis is performed. In the first step the LCA is lifted by 10º about the global 1-direction by applying a displacement boundary condition of 60 mm to the ball joint reference node in the negative global 3-direction. In the second step a concentrated force of 1000 N is applied at the ball joint reference node in the negative global 1-direction. The analysis models a horizontal load on the ball joint as the wheel and, hence, the ball joint go over a bump.
The nonlinear elasticity data obtained from the front bushing are shown in Figure 3.2.4–4, Figure 3.2.4–5, and Figure 3.2.4–6. Similarly, Figure 3.2.4–7, Figure 3.2.4–8, and Figure 3.2.4–9 show nonlinear elasticity data for the rear bushing. It can be seen from the results of Test 8 (Figure 3.2.4–9) that the rear bushing behavior in the local 1-direction is not sensitive to the amount of preload about the local 2-direction. However, the results of Test 7 (Figure 3.2.4–6) show that the front bushing behavior about the local 2-direction is significantly affected by the amount of preload about the local 3-direction.
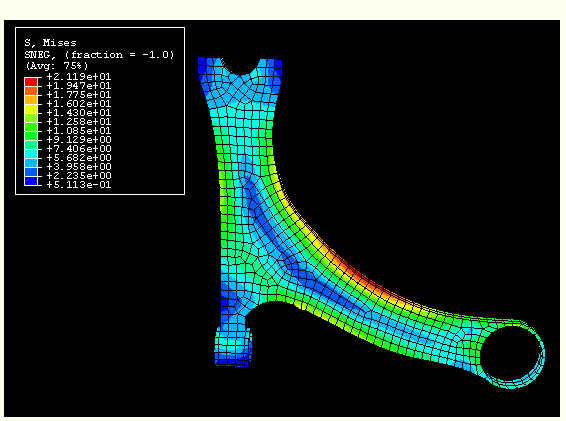
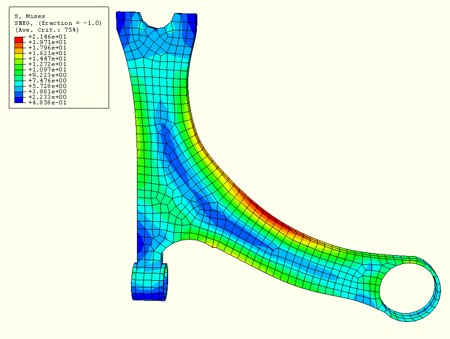
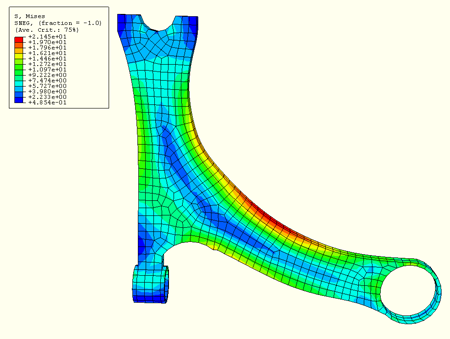
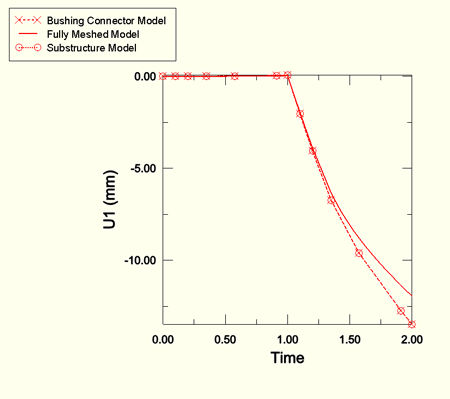
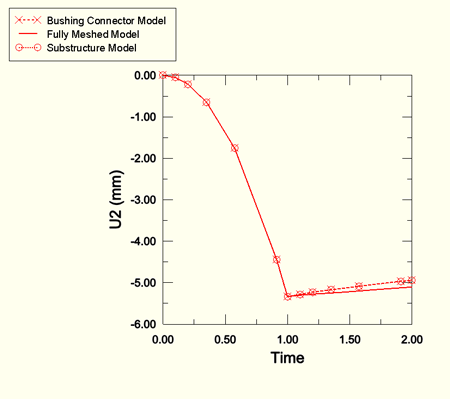
The Mises stresses in the LCA calculated for each of the three models were very similar, as shown in Figure 3.2.4–10, Figure 3.2.4–11, and Figure 3.2.4–12. In addition, displacements in the global 1- and 2-directions at the ball joint (where the loading was applied) show good agreement between the three models (Figure 3.2.4–13 and Figure 3.2.4–14). As expected, the bushing connector model analysis and the substructure model analysis produced identical displacements at the ball joint.
The main motivation to use the BUSHING connector in this and similar applications is to reduce the complexity of the models and the computation time. In this LCA analysis the fully meshed model analysis takes approximately 200 times longer than the bushing connector model analysis. Furthermore, the substructure model analysis completes in about one-seventh of the time required for the bushing connector model. In summary, the results in this application demonstrate that while maintaining accuracy in the results, the cost of similar applications can be drastically (hundreds of times) reduced with the use of BUSHING connectors.
Front bushing analysis for specified translation in the positive local 1-direction (see Test 1).
Front bushing analysis for specified translation in the negative local 1-direction (see Test 1).
Front bushing analysis for specified translation in the local 2-direction (see Test 2).
Front bushing analysis for specified translation in the local 3-direction (see Test 3).
Front bushing analysis for specified rotation about the local 1-direction (see Test 4).
Front bushing analysis for specified rotation about the local 2-direction (see Test 5).
Front bushing analysis for specified rotation about the local 3-direction (see Test 6).
Front bushing analysis for specified rotation about the local 2-direction with 7.5° preload rotation about the local 3-direction (see Test 7).
Front bushing analysis for specified rotation about the local 2-direction with 15° preload rotation about the local 3-direction (see Test 7).
Rear bushing analysis for specified translation in the positive local 1-direction (see Test 1).
Rear bushing analysis for specified translation in the negative local 1-direction (see Test 1).
Rear bushing analysis for specified translation in the local 2-direction (see Test 2).
Rear bushing analysis for specified translation in the local 3-direction (see Test 3).
Rear bushing analysis for specified rotation about the local 1-direction (see Test 4).
Rear bushing analysis for specified rotation about the local 2-direction (see Test 5).
Rear bushing analysis for specified rotation about the local 3-direction (see Test 6).
Rear bushing analysis for specified translation in the positive local 1-direction with 7.5° preload rotation about the local 2-direction (see Test 8).
Rear bushing analysis for specified translation in the negative local 1-direction with 7.5° preload rotation about the local 2-direction (see Test 8).
Rear bushing analysis for specified translation in the positive local 1-direction with 15° preload rotation about the local 2-direction (see Test 8).
Rear bushing analysis for specified translation in the negative local 1-direction with 15° preload rotation about the local 2-direction (see Test 8).
Fully meshed model analysis for Load case 1.
Fully meshed model analysis for Load case 2.
Bushing connector model analysis for Load case 1.
Bushing connector model analysis for Load case 2.
Substructure generation analysis for the lower control arm.
Substructure model analysis for Load case 1.
Substructure model analysis for Load case 2.