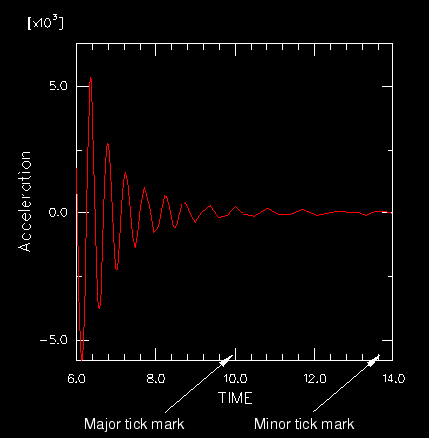
Click the Tick Marks tab to control how many major and minor tick marks appear along the X- and Y-axes of an X–Y plot. You can control the X- and Y-axis tick marks independently. Examples of major and minor tick marks are shown in Figure 29–34.
Major tick marks govern the placement of the X–Y plot major grid and the numeric axis labels. Minor tick marks are shorter, unlabeled marks governing the placement of the minor grid lines.
By default, ABAQUS/CAE automatically computes the number of tick marks. You can specify major tick marks by giving the increment between them or the total number of tick marks. You can specify minor tick marks only by giving the total number between each major tick mark.
The color of the tick marks is governed by the color of the axes. For more information, see “Customizing the X–Y plot axis color and style,” Section 29.5.8.
To control the axis tick marks of an X–Y plot:
Locate the axis Tick Marks options.
Select Options![]() XY Plot from the main menu bar or click
XY Plot from the main menu bar or click ![]() in the toolbox; then click the Tick Marks tab in the dialog box that appears.
in the toolbox; then click the Tick Marks tab in the dialog box that appears.
The Tick Marks options appear.
Choose the method of computing the interval between major tick marks along the X-axis.
From the X-Axis Major options, choose one of the following:
Auto-compute
ABAQUS computes the interval between major tick marks along the X-axis, rounding to provide reasonable intervals.
Increment
The Increment text field becomes available, and you can enter the increment between major tick marks along the X-axis.
Total number
The Total number text field becomes available, and you can enter the total number of major tick marks to appear between the minimum and maximum values along the X-axis.
Specify the number of minor tick marks.
From the X-axis Minor ticks option, click the Ticks per interval arrow to specify the number of minor tick marks between each major tick mark.
Repeat Steps 2 and 3 for the Y-Axis tick mark options.
Click Apply to implement your change.
The axes of the X–Y plot in the current viewport change to reflect your specifications.
Your changes are saved for the duration of the session and will affect all subsequent plots in this mode.