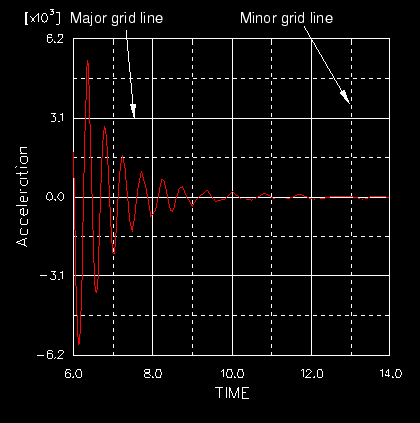
Click the Grid tab to control the appearance of the major and minor grid lines of an X–Y plot. Examples of major and minor grid lines are shown in Figure 29–35.
You can enable and disable the horizontal and vertical lines in either the major or minor grid, and you can select the color, style, and thickness of the lines in each grid.
Note: Major grid lines originate from major tick marks, and minor grid lines originate from minor tick marks. To control the interval between grid lines, you must adjust the spacing of the tick marks.
To customize the grid of an X–Y plot:
Locate the axis Grid options.
Select Options![]() XY Plot from the main menu bar or click
XY Plot from the main menu bar or click ![]() in the toolbox; then click the Grid tab in the dialog box that appears.
in the toolbox; then click the Grid tab in the dialog box that appears.
The Grid options appear.
From the Major Grid Lines options, toggle Show horizontal lines and Show vertical lines to display or suppress the horizontal and vertical lines of the major grid.
When either Show horizontal lines or Show vertical lines is on, grid line style, color, and thickness options become available.
Select the style of the major grid lines.
Click the Style button to reveal the major grid line style options.
In the style list, click the desired line style.
The specified line style appears on the Style button.
Select the color of the major grid lines.
Click the color sample ![]() .
.
ABAQUS/CAE displays the Select Color dialog box.
Use one of the methods in the Select Color dialog box to select a new color. For more information, see “Customizing colors,” Section 3.2.9.
Click OK to close the Select Color dialog box.
The color sample changes to the selected color. The new color does not appear in the viewport until you click OK or Apply in the XY Plot Options dialog box.
Select the thickness of the major grid lines.
Click the Thickness button to reveal the major grid lines thickness options.
In the list of thicknesses, click the desired line thickness.
The specified line thickness appears on the Thickness button.
To select the Minor Grid Lines options, repeat Step 2 through Step 5.
Click Apply to implement your changes.
The grid lines on the X–Y plot in the current viewport change to reflect your specifications.
Your changes are saved for the duration of the session and will affect all subsequent plots in this mode.