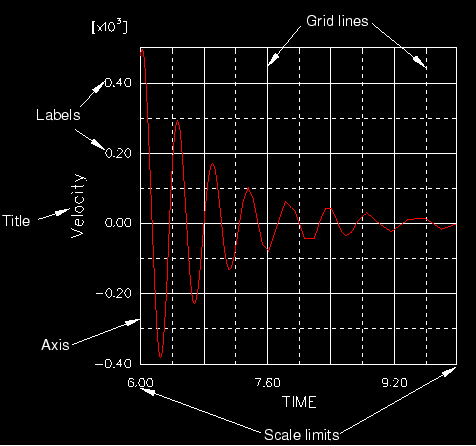
You can use the X–Y plot options to customize the appearance of X–Y plots. Figure 29–33 identifies the X–Y plot characteristics that you can customize. Select Options![]() XY Plot from the main menu bar or click
XY Plot from the main menu bar or click ![]() in the toolbox to access the XY Plot Options dialog box. Click the following tabs to customize the appearance of X–Y plots in the current viewport:
in the toolbox to access the XY Plot Options dialog box. Click the following tabs to customize the appearance of X–Y plots in the current viewport:
Aspect Ratio: Adjust the relative scaling of the X- and Y-axis.
Axes: Choose axes color and thickness, and control numeric axes labels.
Grid: Control the style and occurrence of grid lines.
Scale: Choose axes scales and limits.
Tick Marks: Control the occurrence of tick marks.
Titles: Specify the content and appearance of axes titles.