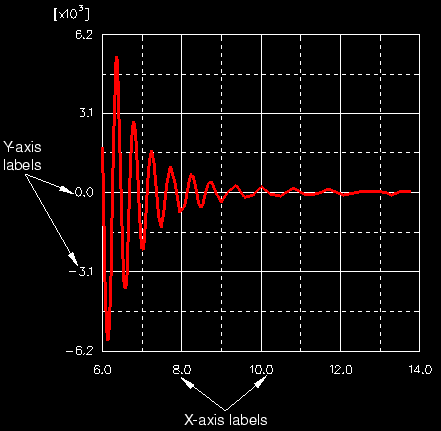
Click the Axes tab to customize the numeric labels that appear with the major tick marks along the X- and Y-axes of an X–Y plot. Examples of axis labels appear in Figure 29–36.
You can customize the following:
The format of the labels (automatic, decimal, or exponential).
The number of decimal places in the labels.
The frequency of the labels in relation to the major tick marks.
The font of the labels.
To control the axes labels of an X–Y plot:
Locate the X-Axis Labels and Y-Axis Labels options.
Select Options![]() XY Plot from the main menu bar or click
XY Plot from the main menu bar or click ![]() in the toolbox; then click the Axes tab in the dialog box that appears.
in the toolbox; then click the Axes tab in the dialog box that appears.
From the X-Axis Labels options, select the format of the X-axis labels.
Click the Format button to reveal the X-axis label format options.
Choose one of the following:
Automatic
Based on the values of your X–Y data, ABAQUS automatically selects decimal or exponential labels with the specified number of decimal places. This method is the default.
Decimal
Use decimal format with the specified number of decimal places.
Exponential
Use exponential format with the specified number of decimal places.
Click the Decimal places arrows to specify the desired number of decimal places in each label.
Click the Frequency arrows to specify how often labels are printed relative to each major tick mark. For example, if you select a frequency of two, labels will appear at every second major tick mark along the axis. If you select a frequency of zero, no labels will be displayed along the axis. You can request a label frequency of at most one greater than the number of major tick marks.
Select the font of the X-axis labels.
Click Set Font to display the Select Font dialog box.
Use the font selector dialog box to object the font properties that you want.
Note: You specify font size as a percentage of the viewport.
Click Apply to see the effect of your font selections.
Click OK to close the Select Font dialog box and return to the axes labels options.
To customize the Y-Axis labels, repeat Step 2 through Step 5.
Click Apply to implement your changes.
The axes labels on the X–Y plot in the current viewport change to reflect your specifications.
Your changes are saved for the duration of the session and will affect all subsequent plots in this mode.