Products: ABAQUS/CAE ABAQUS/Viewer
Benefits: Summary tables and plotting capabilities are now available for job incrementation in each step. Residuals and contact information are now available for each attempt and include similar plotting capabilities to help you quickly locate problematic areas using the Visualization module.
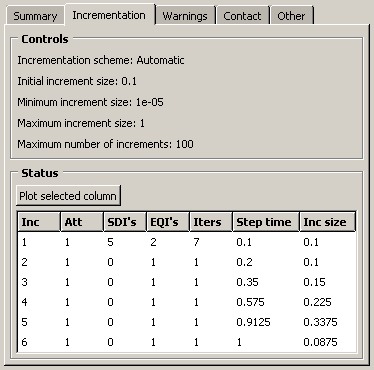
Description: A table summarizing the incrementation information is now available in the Incrementation tab for each analysis step. You can also plot a selected column from the table to view incrementation data graphically. Figure 14–12 shows the incrementation table for a successful step.
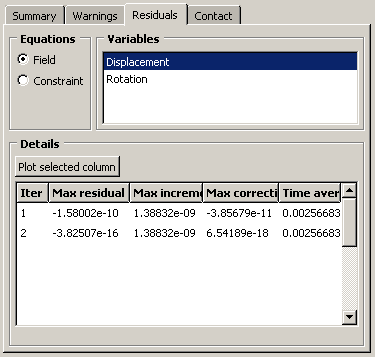
Each attempt in the job history tree now contains summary tables of the residual and contact diagnostic information in the attempt. The table data vary based on the diagnostics available for the attempt. Figure 14–13 shows the options available in the Residuals tab.
The Contact tab is similar; you can display a table of openings or overclosures for each iteration in the attempt. The contact tables contain the iteration number, the total number of openings or overclosures, the maximum opening or overclosure, and the node number where the maximum occurred.Visualization module: ToolsJob Diagnostics