Products: ABAQUS/CAE ABAQUS/Viewer
Benefits: You can now control the type of progression between discrete contour intervals when you display a contour plot. You can also create a new spectrum of colors to customize your display of contour plots using any series of colors that you want.
Description: When you represent a contour plot using discrete contour intervals, you can also control the type of progression between interval values. A uniform interval type creates an arithmetic progression between contour intervals, a logarithmic interval type creates a multiplicative progression, and a user-defined interval type enables you to create a custom progression that includes any values you want to specify. This enhancement provides you with greater control over the intervals in a contour plot.
The Spectrum options in the Contour Plot Options dialog box have also changed in the following ways:
You now choose the color spectrum you want to use for a contour plot by selecting its name. ABAQUS/CAE provides the same seven predefined color spectra that were available in Version 6.5, with the following names: Black to White, Blue to Red, Rainbow (which starts with red and ends with blue), Red to Blue, Reversed rainbow, White to black, and Wraparound (which starts with red, turns blue, and finishes back at red).
Red to Blue and Rainbow have the same spectrum colors and arrangement but differ in the way that ABAQUS/CAE interpolates the values between the colors. ABAQUS/CAE uses an RGB interpolation scheme for contour plots when you use Red to Blue, while Rainbow plots are interpolated with an HGV interpolation scheme.
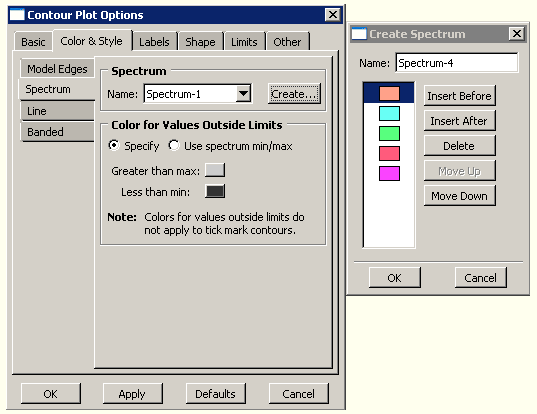
You can create a new color spectrum by clicking Create, then modifying the color values and arrangement in the Create Spectrum dialog box. Figure 14–11 shows this dialog box for a sample spectrum of five colors.
Visualization module:
  OptionsContour: Color & Style: Spectrum: Create