Products: ABAQUS/CAE ABAQUS/Viewer
Benefits: You can now plot contours of element integration point variables as two-dimensional fronts that appear at section points of continuum shells. You can also display contour plots for two section locations on the same conventional or continuum shell.
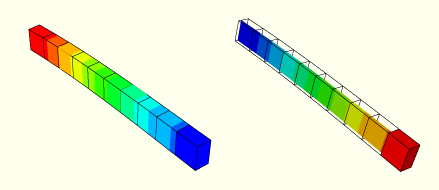
Description: When you plot contours for a continuum shell, ABAQUS/CAE now displays the contour values as a two-dimensional front at one of the continuum shell's section points. This enhancement provides a more specific and meaningful display of contours for continuum shells; previously, contour plots displayed the color of the selected section point throughout the solid continuum shell element, which implied that contour values were uniform throughout the element. Figure 14–14 demonstrates this difference with contour plots of the same model; the Version 6.5 plot appears on the left and the Version 6.6 plot appears on the right.
Figure 14–14 Contour plots of continuum shell elements in Version 6.5 (left) and Version 6.6 (right).
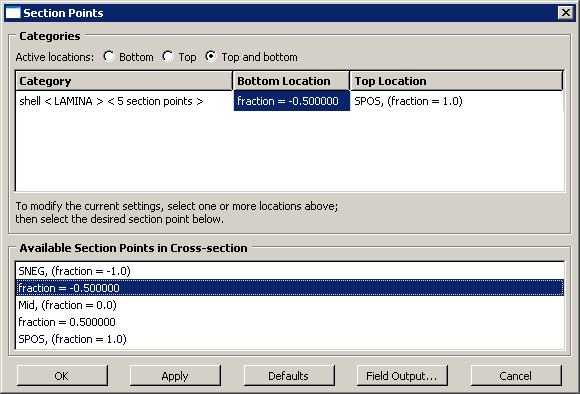
For three-dimensional shell elements you can also display contour values for two different section point locations. For a conventional shell these two contours appear as a double-sided shell with different contours on each side, and for a continuum shell these two contours appear as distinct two-dimensional contour fronts at each section point location. To accommodate the display of two section points in the same plot, the Section Points dialog box now includes Bottom Location and Top Location fields (see Figure 14–15). You can use the Active locations radio buttons at the top of this dialog box to activate either or both of these locations.
The two-dimensional front functionality is supported only for contour plots. The ability to display two section point locations is supported only for contour plots of integration point variables on three-dimensional shells; in all other contexts when you select Top and bottom, ABAQUS/CAE displays data only at the Bottom Location section point.
Visualization module:
   ResultsSection Points