 © 2001, Washington University in St. Louis. Created
by Ajey Dambal (under the guidance of Dr.Motard & Dr.Joseph).
Binary System Equilibrium
(see what the underlined words are, in the status bar, by placing your mouse on it)
The T-x,y Plot

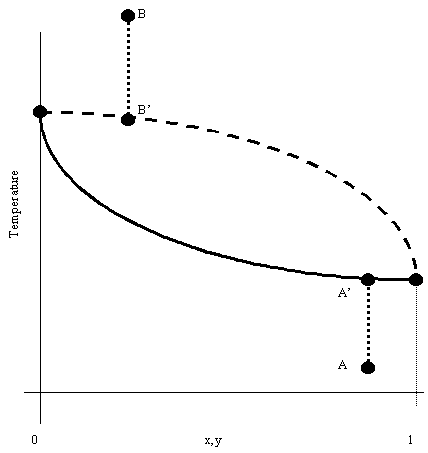
The T-x,y plot represents the states of a system at different temperatures, given a constant pressure. The solid line represents the saturated liquid and the dashed line represents the saturated vapor. The region in between these lines is called the 2 Phase region. The area of the graph above the saturated vapor line is the super-heated vapor region and the area below the saturated liquid line is called the supercooled liquid region.
As can be seen on the graph, if a liquid at an arbitrary point A is heated at constant pressure, it reaches point A' - its Bubble Point Temperature. Also, if a gas at an arbitrary point B is cooled at constant pressure, it hits point B' - its Dew Point Temperature.
The P-x,y Plot

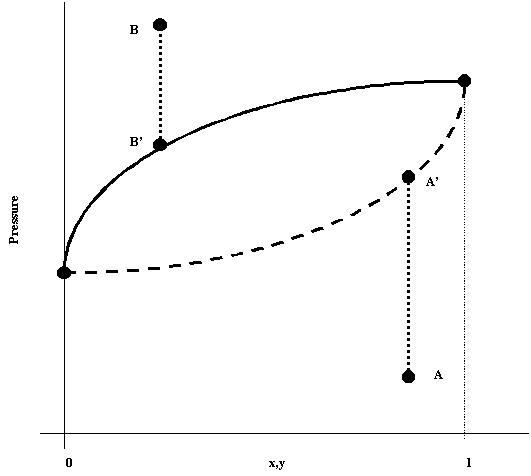
Analogous to the T-x,y plot, the P-x,y conveys system information. It depicts the condition of a given system (at constant temperature) at different pressure states. Like the previous diagram, the solid line represents the saturated liquid and the dashed line the saturated vapor. Now, the region below the vapor line is the superheated vapor and the region above the liquid line is the supercooled liquid. The 2 Phase region remains the same.
Note that although superficially the 2 diagrams are allike, they are different and convey information in different ways.
Like the Bubble point temperature, there exists a Bubble Point Pressure which is reached when a system is depressurized from an arbitrary point B to B'. Similarly, when one pressurizes a system from an arbitrary A to A', one reaches the Dew Point Pressure.