 © 2001, Washington University in St. Louis. Created
by Ajey Dambal (under the guidance of Dr.Motard & Dr.Joseph).
Phase Diagrams
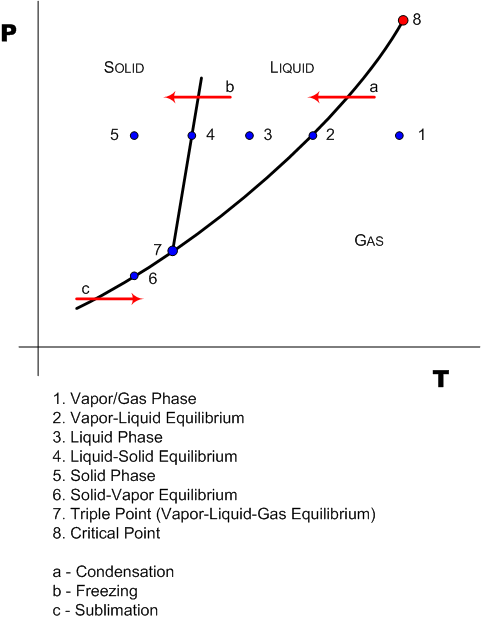
A phase diagram for a single species system is shown below...

This should not be confused with a binary system P-xy and T-xy diagram. By looking at a phase diagram, you can determine the state/phase of the system given a set of T,P data-points.
The lines represents the infinite T,P sets at which two different phases of the species can co-exist.
Single Species P-v Diagram is shown below...

What has also been represented on the diagram is an Isotherm - a line representing constant temperature. The isotherm that passes through 1-2-3-4-5 is less than critical temperature. All isotherms less than critical temp pass through the 2 phase region. An isotherm at Tc passes through the critical point (Vc,Pc). At higher temperature, isotherms exist in the supercritical region.
T-V Diagram for Single Species

Like isotherms on the P-V diagram, there exist Isobars - constant pressure- here. Like Isotherms, isobars at critical pressure pass through the critial point (Vc, Tc). At lower pressures, they pass through the two phase region and at higher values, they exist in the supercritical region.
Single Species...