Difference between revisions of "Stock Analysis"
Keithkamons (talk | contribs) |
Keithkamons (talk | contribs) |
||
| Line 66: | Line 66: | ||
===The Graphical User Interface=== | ===The Graphical User Interface=== | ||
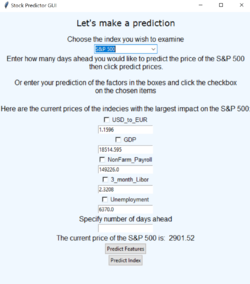
| − | [[File: interface.png|250px|thumbnail|right| | + | [[File: interface.png|250px|thumbnail|right|GUI main page]] |
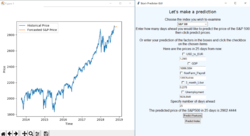
[[File: Sponly.png|250px|thumbnail|right|Predicted S&P 500 price in 25 days]] | [[File: Sponly.png|250px|thumbnail|right|Predicted S&P 500 price in 25 days]] | ||
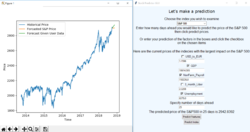
[[File: feats.png|250px|thumbnail|right|User inputs predicted changes in feature prices]] | [[File: feats.png|250px|thumbnail|right|User inputs predicted changes in feature prices]] | ||
We created a GUI using Python's Tkinter toolbox. We modeled our GUI after the ''Programming GUIs and windows with Tkinter and Python'' <ref>Python GUI Tutorial - [https://pythonprogramming.net/tkinter-depth-tutorial-making-actual-program/]</ref> embedded with the functions as mentioned above. The GUI consisted of a single frame which was updated based on user inputted data. | We created a GUI using Python's Tkinter toolbox. We modeled our GUI after the ''Programming GUIs and windows with Tkinter and Python'' <ref>Python GUI Tutorial - [https://pythonprogramming.net/tkinter-depth-tutorial-making-actual-program/]</ref> embedded with the functions as mentioned above. The GUI consisted of a single frame which was updated based on user inputted data. | ||
| − | + | ||
| − | + | The main page displayed the current prices of the features and index being examined. The page was generated iteratively based off of the excel file that the data was stored in. This allows for the information to be changed dynamically in the future. Users have two options. First, the user could input a number of days, then let the model predict the price of the S&P 500 along with the features and a visualization in the specified number of days. Secondly, the user can choose which features they think will change and enter in their prediction. The model will then output the forecasted price of the S&P 500 based on the users changes. This data is plotted with predicted price of the S&P 500 in the specified number of days to see how the user's prediction aligns with the models prediction based on no change. | |
| − | |||
| − | |||
| − | |||
| − | |||
| − | |||
| − | |||
| − | |||
| − | |||
| − | |||
=Results= | =Results= | ||
Revision as of 17:49, 8 December 2018
Link to Project Log: Stock Analysis Log
Link to GitHub: [1]
Project Overview
The financial market is an extremely complicated place. While there are many metrics used to measure the health of markets, market values such as the S&P 500, Russell 2000, and the Dow Jones Industrial average are the ones that we will focus on. We will build models of the market so that users can input how they think the interest rate, unemployment rate, price of gold, and other factors will change, and our models will predict how the market will react to those changes. The user will enter their predictions into a user interface, and the product will output visual aid as well as estimated prices and behavior. Our product will help users make more informed investment decisions.
Group Members
- Brandt Lawson
- Keith Kamons
- Jessica
- Chang Xue (TA)
Objectives
Produce a user interface which, given a user specified value for some factors, can predict what impact this change will have on future index values. The accuracy and precision of the model can be determine through back testing and measure the success of the project. We will demonstrate our project by allowing users to predict changes in many factors and to see how our model does at predicting the markets reaction.
Challenges
- Learning how to use MySQL.
- The web security behind sharing data online and how to accomplish this in a safe and secure way.
- Learning how to use Python's data analysis toolboxes.
- Nobody in the group has taken a course or studied how many of the analysis tools and underlying math and computer science works, so it will be incredibly challenging to figure it all out along the way.
- Integrating this software across different platforms and allowing everyone in the group to have access to this data.
- Data collection and storage in an efficient and complete way
- Collecting data in an autonomous and dynamic way will be a challenge due to the ways that resources such as Google Finance, Yahoo Finance and Quandl change their policies on data collection.
- Manual data collection and cleaning while the code for autonomous collection and analysis is setup.
Gantt Chart
Budget
Our goal is to exclusively use open source data and software, which makes our budget $0.00.
Data
Data Scraping
In order to enable our data set to dynamically update, we must create code that will "scrape" the newest information from the specified website.
Database
Once this new data is scraped, we will add it to our relational database using SQL. This will make it more organized and easily searchable.
App Prototype
Design & Solutions
The Data Management
One of the biggest challenges we faced was in data collection and management. Originally we intended on using an API to dynamically fetch data and store it in a MySQL database we configured on an Amazon EC2 Micro Instance. We attempted to use Quandl, GoogleFinance, and YahooFinance's APIs but they were decommisioned so we were unable to utilize them. To resolve this issue, we wrote a scraper in Python that read data from several Google Finance webpages, but ultimately our requests to the webpages were blocked by Google. This forced us to reconsider how we should collect and store data. Our workaround for this issue was to keep our dataset static and to collect our data from the Bloomberg terminal.
The results generated for the output relied on historical pricing of market indicators and indices. We collected pricing data on several commodities, indices, and indicators through a Bloomberg terminal. This posed as a challenge for us because the Bloomberg terminal has a large amount of data for each price we examined. We had to research the syntax of tickers and how to understand the long-term contracts involved so we could pull the pricing data. We then exported and stored the data in an excel workbook.
After collection, the data was then processed using Python's pandas and numpy toolboxes. The data from the year 1980 through 2018 was collected, but data did not exist for every day in the range, so there were holes in the data set. By storing the data in a pandas data frame we were able to iterate over the dataset and process all of the misformatted points by replacing them with a standard (#N/A) message.
Originally planned to have data scrapped from the web to enable live updates and stored into a database.
Then used Bloomberg Terminal for collecting and exporting data.
Determine which data needs to be pulled. Data Cleaning
The Statistical Analysis
The Graphical User Interface
We created a GUI using Python's Tkinter toolbox. We modeled our GUI after the Programming GUIs and windows with Tkinter and Python [1] embedded with the functions as mentioned above. The GUI consisted of a single frame which was updated based on user inputted data.
The main page displayed the current prices of the features and index being examined. The page was generated iteratively based off of the excel file that the data was stored in. This allows for the information to be changed dynamically in the future. Users have two options. First, the user could input a number of days, then let the model predict the price of the S&P 500 along with the features and a visualization in the specified number of days. Secondly, the user can choose which features they think will change and enter in their prediction. The model will then output the forecasted price of the S&P 500 based on the users changes. This data is plotted with predicted price of the S&P 500 in the specified number of days to see how the user's prediction aligns with the models prediction based on no change.
Results
Comparison to Objectives
Our project met our basic objectives and goals. We successfully created a user interface that allows users to predict values for certain factors and to calculate the effect these changes will have on future values of an index. The interface outputs a visual aid to display behavior as well as a specific estimate for the price. Additionally, we included a feature that allows the user to specify the number of days ahead they wish to predict the values of the index.
After meeting out basic goals, we hoped to potentially model several different market indexes instead of just the S&P 500, such as the Russel 2000 and the Dow Jones Industrial Average. We also used different factors for analysis than originally mentioned, but this did not impact the success of the project. The factors we used were the US Dollar to Euro currency exchange rate, gross domestic product, nonfarm payroll, 3 month libor, and the unemployment rate compared to interest rate, price of gold, and unemployment rate. The interface allows the user to select a combination of the possible factors and creates a reasonable prediction given the factors and the amount of change predicted. The visual aid properly depicts the prediction given these changes as well as showing the past values of the index. We intended for the display to be embedded inside of the user interface, however after facing difficulties at updating the plot, we settled on having the plot pop up in a new window.
Source Code: GitHub
Critical Decisions
We would have liked to have a dynamic data feed for live updating of the data, however the websites we attempted to scrape the data from blocked us. To obtain our data, we resorted to using the Bloomberg Terminal, which was static data.
What next?
To expand the usability of our project, we would implement more market indexes as well as implement more features. When we tried to train the model using more features, the program crashed due to the large computation time and complexity of the statistical analysis. To implement more features, we would need a computer that can handle significantly more data or we would need to refine the algorithms to make them more efficient.
We would also use dynamic data feed to allow the data to have live updates and be up to date to what is currently happening in the market. For this, we would need to find a site that we could use its API for data collection or to find a way to prevent the scraper from getting noticed and blacklisted.
Deep learning
Poster
References
CSE330 Linux, SQL and AWS info
Python Machine Learning (Sebastian Raschka) 2nd Edition ISBN-10: 1787125939
ARIMA parameters documentation


