Difference between revisions of "Cholera MapReduce Application"
| Line 81: | Line 81: | ||
Our Visualization App: | Our Visualization App: | ||
| − | {{Viz| | + | {{Viz|CholeraOutbreakViz|mapreduce.apps.cholera.viz}} |
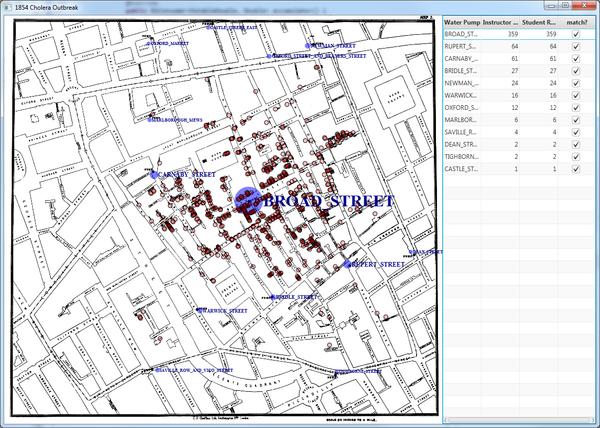
[[File:CholeraOutbreak.png|600px]] | [[File:CholeraOutbreak.png|600px]] | ||
| Line 87: | Line 87: | ||
If you have chosen to go a different route than the ones we anticipated, do not worry about passing the test suite. Demo your work to an instructor in class and we can discuss its fitness. | If you have chosen to go a different route than the ones we anticipated, do not worry about passing the test suite. Demo your work to an instructor in class and we can discuss its fitness. | ||
| − | {{TestSuite| | + | {{TestSuite|_CholeraOutbreakTestSuite|mapreduce.apps.cholera.exercise}} |
| + | |||
| + | =Pledge, Acknowledgments, Citations= | ||
| + | {{Pledge|map-reduce-cholera-app}} | ||
Revision as of 04:55, 5 March 2023
Contents
Motivation
Epidemiology is the important study of "why certain people are getting ill."
We get a chance to make sense of the data in a relatively open-ended studio.
Background
| Video: Extra History: The Broad Street Pump |
|---|
|
|
Imagine you are a physician in 1854 London in the midst of a cholera outbreak. Your theory that contaminated water is the cause meets resistance from the medical establishment which holds that it is spread via the air.
Imagine further that your friend Ada has taught you to program.
Code To Use
You will be asked to produce evidence from CholeraDeath locations and WaterPump locations. The CholeraDeath data is from this GIS Analysis and made available in Java in SohoCholeraOutbreak1854. source: deaths.txt.
The WaterPump data is available via WaterPump.values()
source: pumps.txt.
Code To Implement
In order to provide a more open-ended assignment, we have abstracted out different aspects of the studio. In particular, getValueRepresentation() allows you to specify whether your CholeraApp sees high or low numbers as suspects. For example, if you return ValueRepresentation.HIGH_NUMBERS_SUSPECT, you are indicating that a higher number is more likely to indicate that the water pump is the source of the cholera outbreak. This will aid the #Visualization in presenting your findings.
We have anticipated two basic approaches to this problem (with a variation^2 on one of the approaches). You may choose to implement an integer-based or a double-based CholeraApp. If you take a different approach than one we have anticipated, that is fine. Get it checked out by an instructor.
CholeraOutbreak
| class: | CholeraOutbreak.java | |
| methods: | produceEvidence | |
| package: | mapreduce.apps.cholera.exercise | |
| source folder: | student/src/main/java |
valueRepresentation
method: public static ValueRepresentation valueRepresentation() ![]() (sequential implementation only)
(sequential implementation only)
You have been provided with this implementation which should be sufficient:
public static ValueRepresentation valueRepresentation() {
    return ValueRepresentation.AUTO_DETECT;
}
thresholdIfApplicable
method: public static Optional<Double> thresholdIfApplicable() ![]() (sequential implementation only)
(sequential implementation only)
For the vast majority of students, a threshold value will not be applicable to their solution and thus this method need not to be changed:
public static Optional<Double> thresholdIfApplicable() {
	final boolean IS_THRESHOLD_APPLICABLE = true;
	if (IS_THRESHOLD_APPLICABLE) {
		throw new NotYetImplementedException();
	} else {
		return Optional.empty();
	}
}
However, if your solution has a threshold value which would be necessary for visualization and testing, return it here via Optional.of(threshold).
Again, you need not concern yourself with this method if you are going with a threshold-less strategy.
Testing Your Solution
Visualization
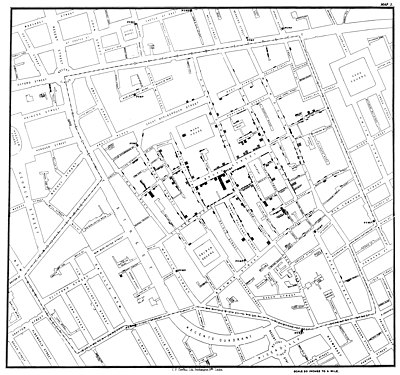
Original Map Drawn By John Snow:
Our Visualization App:
| class: | CholeraOutbreakViz.java | VIZ |
| package: | mapreduce.apps.cholera.viz | |
| source folder: | student/src//java |
Correctness
If you have chosen to go a different route than the ones we anticipated, do not worry about passing the test suite. Demo your work to an instructor in class and we can discuss its fitness.
| class: | _CholeraOutbreakTestSuite.java | |
| package: | mapreduce.apps.cholera.exercise | |
| source folder: | testing/src/test/java |
Pledge, Acknowledgments, Citations
| file: | map-reduce-cholera-app-pledge-acknowledgments-citations.txt |
More info about the Honor Pledge


