Use the trigonometric functions cos, cosh, acos, sin, sinh, asin, tan, tanh, and atan to operate on a previously saved X–Y data object (a collection of ordered pairs) to produce a new X–Y data object. The new X–Y data object has the same X-coordinate values as the original X–Y data object, but new Y-coordinates are computed as the trigonometric function value of each original Y-coordinate. Arguments to trigonometric functions are assumed to be in radians.
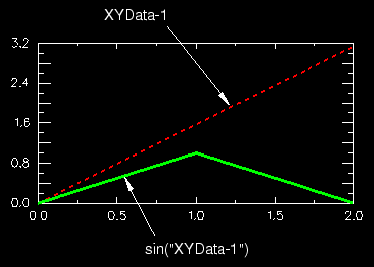
For example, if
![]()
![]()
To apply trigonometric functions to an X–Y data object:
Locate the Operate on XY Data dialog box.
From the main menu bar, select Tools![]() XY Data
XY Data![]() Create. Click Operate on XY data in the dialog box that appears; then click Continue. The Operate on XY Data dialog box appears.
Create. Click Operate on XY data in the dialog box that appears; then click Continue. The Operate on XY Data dialog box appears.
From the Operators listed, click one of the following trigonometric functions:
| sin(A) | To compute the sine of your X–Y data object. |
| sinh(A) | To compute the hyperbolic sine of your X–Y data object. |
| asin(A) | To compute the arcsine of your X–Y data object. Your Y-data values must be in the range [–1, 1]. |
| cos(A) | To compute the cosine of your X–Y data object. |
| cosh(A) | To compute the hyperbolic cosine of your X–Y data object. |
| acos(A) | To compute the arccosine of your X–Y data object. Your Y-data values must be in the range [–1, 1]. |
| tan(A) | To compute the tangent of your X–Y data object. |
| tanh(A) | To compute the hyperbolic tangent of your X–Y data object. |
| atan(A) | To compute the arctangent of your X–Y data object. |
The trigonometric function you choose appears in the expression window.
From the XY Data choices, click the name of the X–Y data object on which to operate and click Add to Expression. You can choose from all X–Y data objects previously saved within this session (listed alphabetically in the XY Data field).
The X–Y data object name appears within the trigonometric function parentheses in the expression window.
To continue to build your expression, position the cursor in the expression window and type in or select the functions, operators, and X–Y data you want to include.
To evaluate and display your expression, click Plot Expression.
To save your new X–Y data object, click Save As and then provide a name in the dialog box that appears.
Saving your data object makes it available for future operations within this session and for inclusion in X–Y plots containing multiple data objects.
When you are finished, click Cancel to close the dialog box.