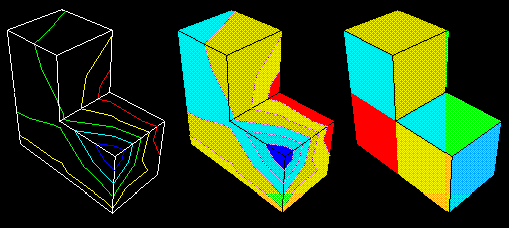
A contour plot displays results that are stored in the output database. Each contour plot displays the values of a particular field output variable at a specified step and frame of the analysis. These values are shown as colored lines, colored bands, or quilt-type colored faces on the surface of your model, depending on the customization options you select. A contour plot cannot be produced if no elements are visible in the current viewport. Line, banded, and quilt-type contours are shown in Figure 26–1.
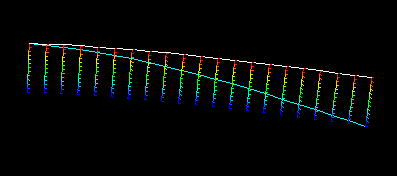
As with other elements, contour lines for line-shaped elements (beams, one-dimensional elements, gasket link elements, and three-dimensional line gasket elements, as well as two-dimensional contact surfaces) are plotted along the elements by default. Line-type contour plots are not recommended for line-shaped elements. Tick mark contour plotting provides an alternative means of visualizing contours on beams and other line-shaped elements. The contour is displayed as a curve plotted between two sets of lines normal to the elements, as shown in Figure 26–2. The contour level is indicated by “tick marks” on these normal lines.
The key to interpreting a contour plot is the plot legend. The legend indicates the correspondence between contour values and contour colors.
By default, ABAQUS/CAE evenly divides the difference between the minimum and maximum values in the legend into 12 intervals. You can change the number of intervals if necessary. A color is associated with each interval. For a line-type contour plot each colored contour line corresponds to a set of locations in the model for which the field output variable has the value shown in the legend. For a banded contour plot each colored contour band corresponds to a range of values within the bounds indicated by the legend. For a quilt contour plot each colored element face corresponds to a single value within the bounds indicated by the legend for that color. For a tick mark contour plot each colored tick mark corresponds to a single value indicated by the legend.
This section discusses the computation and rendering of contour values and the computation of contour limits. The following topics are covered: