Product: ABAQUS/Explicit
Modeling large underwater structures subject to shock loads typically leads to computationally intensive numerical models that require considerable computing resources. This example illustrates how ABAQUS/Explicit on a 64-bit HP-Itanium platform can be used to predict the transient response of such a large and complicated structure subject to a shock wave loading resulting from an underwater explosion (UNDEX). A publicly available full submarine model is modified via a modeling approach that minimizes the computational costs and obtains an accurate response in a particular region of interest. Consequently, particular attention is given to structural details in the respective region of interest, while simplifications meant to reduce analysis costs are assumed elsewhere.
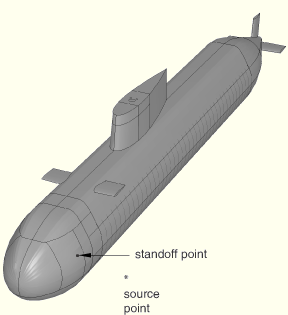
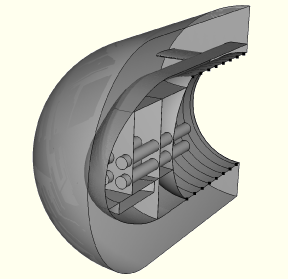
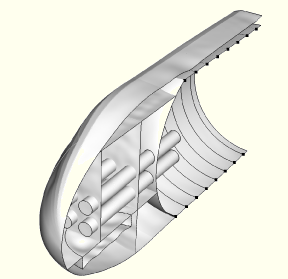
The structure is loaded by an incident wave with a shock profile amplitude. If structural integrity is analyzed, a reasonable assumption is that most affected regions will be around the standoff point; thus, more attention to modeling details should be paid to the front part of the submarine (Figure 8.1.5–1 and Figure 8.1.5–5).
The model presented was created based on specifications provided by Forschungsanstalt der Bunderwehr für Wasserschall und Geophysik (FWG), Kiel, Germany (Fiedler and Schneider, 2002). This model is known as the Benchmark Target Strength Simulation (BeTSSi) model and is a reasonably sophisticated replica of a Kilo-class Soviet submarine. The complexity of the structure is considered suitable for testing target-strength simulation codes for more realistic problems (Schneider et al., 2003). In this example problem the BeTSSi model is adapted to test ABAQUS/Explicit for a realistic UNDEX simulation.
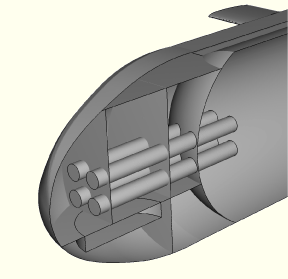
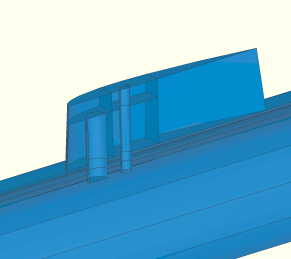
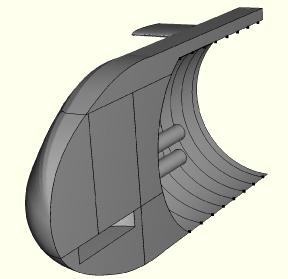
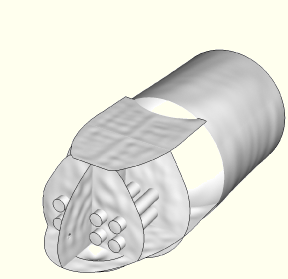
Structural details include flooded bow compartments, sonar array, torpedo tubes, flooded sail compartments, sail access tubes, and an aft chamber (Figure 8.1.5–1 through Figure 8.1.5–4). The pressure hull is enveloped by an external hull only along the upper side and is in direct contact with the fluid throughout the bottom side. The intra-hull space is also flooded along the length of the submarine.
The entire structure is hit by a spherical shock wave due to the explosion of a charge located 16.5 m away from the submarine (Figure 8.1.5–1). The pressure-time signal corresponds to a 60lb HBX-1 charge, as in “Response of a submerged cylinder to an underwater explosion shock wave,” Section 8.1.3, and taken from Kwon & Fox (1993).
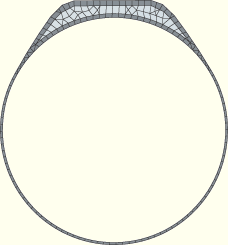
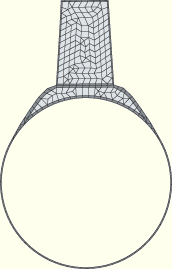
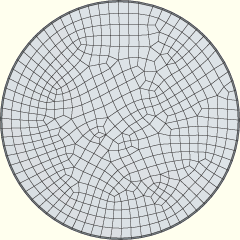
Since the Kwon & Fox (KF) load signal carries a large excitation spectrum, the outside water has to extend to a large distance, corresponding to the lowest end of spectrum, and both the submarine structure and the outside water have to be discretized with a small element size, corresponding to the wavelength of the high end of the spectrum. This generates a considerably large computational model, due also to the significant difference between the length of the submarine model (62 m) and the low wavelength of the high end of the spectrum. Consequently, a modeling approach is employed in this example problem where a “region of interest” is defined around the shock-wave standoff point. The reduced model still includes details such as flooded bow compartments, torpedo tubes, a sonar dome, and a portion of the pressure and exterior hulls, with the fluid domain defined in the intra-hull space. In addition, stiffeners are added for the detailed region of the pressure hull. The rest of the submarine model is simplified using beam elements, coupled with the region of interest using kinematic coupling constraints. The section behavior of the beams is defined using meshed cross-sections to approximate the cross-section inertia of the real structure (Figure 8.1.5–6, Figure 8.1.5–7, and Figure 8.1.5–8). The tapered region at the back of the submarine is approximated via 13 stepwise-constant circular cross-sections. Finally, the inertia effects of the outside water are included.
The exterior acoustic domain (water) envelops only the region of interest and extends to a distance of approximately 1.5 m from the submarine structure, corresponding to half the wavelength inwater at a frequency of 500 Hz. Impedance boundary conditions are applied on truncation surfaces to reduce spurious reflections.
Applying the above simplifications and element sizes of ![]() for the structure and
for the structure and ![]() for both the inner and outer water domains, the aggregate model size is 1.2 million nodes and 5.1 million elements, including AC3D4, S4R, S3R, and B31 elements. The analysis is stopped after 6 ms, enough for the wavefront traveling through the acoustic medium to sweep the region of interest.
for both the inner and outer water domains, the aggregate model size is 1.2 million nodes and 5.1 million elements, including AC3D4, S4R, S3R, and B31 elements. The analysis is stopped after 6 ms, enough for the wavefront traveling through the acoustic medium to sweep the region of interest.
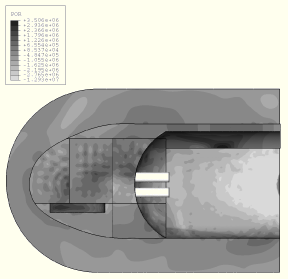
The pressure for the inner and outer acoustic domains is depicted in Figure 8.1.5–9 at the end of the 6 ms response. Observe the high-frequency content of the acoustic pressure inside the bulkheads, due to the excitation from the walls. The high-frequency content of the waves in the bulkheads' walls can be seen in Figure 8.1.5–13 and Figure 8.1.5–14.
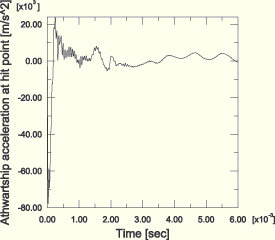
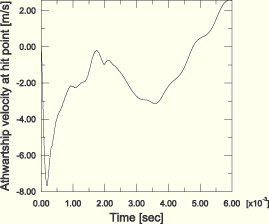
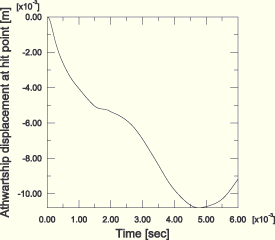
Figure 8.1.5–10, Figure 8.1.5–11, and Figure 8.1.5–12 illustrate the history of acceleration, velocity, and displacement responses at the standoff point, respectively. A kick-off acceleration of almost 8 km/s2 is reached due to the initial shock, followed by a rapid decay. By the end of the shock duration (4 ms), it is almost stabilized around zero. The kick-off velocity reaches a value of almost 8 m/s, while the athwartship displacement shows a maximum drift of about 10 mm.
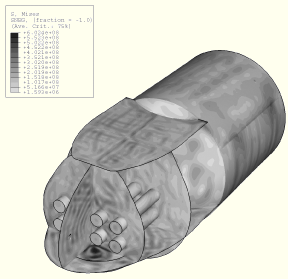
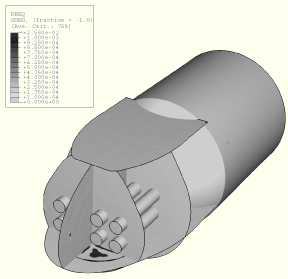
Structural integrity is one of the major concerns of such an analysis. Almost the entire structure is assumed to be made of perfect elastic-plastic steel plates, with position-dependent thicknesses. The only exceptions are the stiffeners, defined as beams with T cross-sections. The material is the same as for the rest of the submarine model, a perfect elastic-plastic steel. High stress concentration regions are analyzed by plotting Mises stresses (Figure 8.1.5–15); permanent deformations are monitored via the equivalent plastic strain (Figure 8.1.5–16). High stress concentration regions as well as permanent deformations are observed for regions around the joints. The maximum stresses are observed on the upper panels of the sonar dome, while the largest permanent deformation is obtained around the joint between the pressure hull, the exterior hull, and the horizontal bow compartment.
Driver input file.
Parts definition input file.
Assembly input file.
Outer water mesh data.
Inner water mesh data.
Submarine structure mesh data.
Element set definitions for the tapered region of the submarine body.
Section data for the element sets defined for the tapered region of the submarine body.
Amplitude data.
Impedance and incident wave model data.
Material data.
Tie definitions.
Step data.
Boundary condition data.
Output request data.
Section mesh data for generating cross-section beam properties for the front region of the submarine.
Section mesh data for generating cross-section beam properties for the sail region of the submarine.
Section mesh data for generating cross-section beam properties for the 1st back region.
Section mesh data for generating cross-section beam properties for the 2nd back region.
Section mesh data for generating cross-section beam properties for the 3rd back region.
Section mesh data for generating cross-section beam properties for the 4th back region.
Section mesh data for generating cross-section beam properties for the 5th back region.
Section mesh data for generating cross-section beam properties for the 6th back region.
Section mesh data for generating cross-section beam properties for the 7th back region.
Section mesh data for generating cross-section beam properties for the 8th back region.
Section mesh data for generating cross-section beam properties for the 9th back region.
Section mesh data for generating cross-section beam properties for the 10th back region.
Section mesh data for generating cross-section beam properties for the 11th back region.
Section mesh data for generating cross-section beam properties for the 12th back region.
Section mesh data for generating cross-section beam properties for the 13th back region.
Fiedler, Ch., and H. G. Schneider, “BeTSSi-Sub—Benchmark Target Strength Simulation Submarine,” Technical Report, Forschungsanstalt der Bundeswehr für Wasserschall und Geophysik, Kiel, 2002.
Kwon, K. W., and P. K. Fox, “Underwater Shock Response of a Cylinder Subjected to a Side-On Explosion,” Computers and Structures, vol. 48, no.4, 1993.
Schneider, H. G. et al., “Acoustic Scattering by a Submarine: Results from a Benchmark Target Strength Simulation Workshop,” Proceedings of Tenth International Congress on Sound and Vibration, Stockholm, Sweden, 2003.