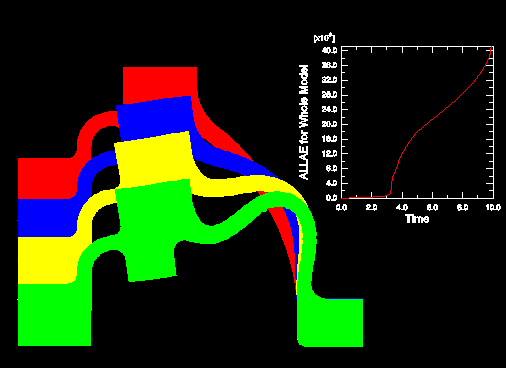
You can create a display that contains multiple plots in one viewport; for example, you may want to combine an undeformed plot, a contour plot, and an X–Y plot or compare the deformed plot shapes from two different output database files in the same viewport. Overlay plots are composed of layers; each layer contains one plot, and the layers are stacked on top of each other to create the combined plot. Figure 52–1 shows a plot containing the deformed shape plots at four different increments of an analysis as well as an X–Y plot of the strain energy in the model versus time.
By default, the viewport does not contain any layers; only one plot at a time is displayed. To overlay multiple plots, you create a layer for each individual plot as you interact with ABAQUS/CAE. You then choose the layers to display in the current viewport. You can create as many layers as you would like; any number of layers can be displayed in the same viewport.
You use the Overlay Plot Layer Manager to create, display, position, and delete layers. To access the Overlay Plot Layer Manager, select View![]() Overlay Plot from the main menu bar. When you create a layer, it contains everything that is visible in the current viewport. You cannot change the contents of a layer once it has been created, but you can manipulate the view, reorder the layer with respect to the other layers in the overlay plot, and change the various display options that are applied to the contents. By default, layers are plotted directly on top of one another. Sometimes lines that appear directly on top of one another can create undesirable visual effects. You can offset the layers with respect to each other to avoid such display anomalies.
Overlay Plot from the main menu bar. When you create a layer, it contains everything that is visible in the current viewport. You cannot change the contents of a layer once it has been created, but you can manipulate the view, reorder the layer with respect to the other layers in the overlay plot, and change the various display options that are applied to the contents. By default, layers are plotted directly on top of one another. Sometimes lines that appear directly on top of one another can create undesirable visual effects. You can offset the layers with respect to each other to avoid such display anomalies.
The settings in the Overlay Plot Layer Manager are applied to the contents of the current viewport only when you click Plot/Apply. ABAQUS/CAE then enters the overlay plot mode; when you click Cancel in the Overlay Plot Layer Manager or Done in the prompt area, the overlay plot disappears from the viewport and the display reverts back to the previous plot mode.
When you are in the overlay plot mode, ABAQUS/CAE displays your plots relative to an overlay plot coordinate system. As you create a layer, ABAQUS/CAE assigns the view in which the layer was created to the overlay plot front (1–2) view. You can modify what is displayed in the overlay plot front view by manipulating the view for each individual layer, as described in “Manipulating the view for an overlay plot,” Section 52.2.3. User-specified views defined in the overlay plot mode are relative to the overlay plot coordinate system.
Columns in the Overlay Plot Layer Manager display the following information about each layer:
Visible
A check mark in this column indicates that the layer is visible in the viewport when you are in the overlay plot mode.
Current
A check mark in this column indicates that the layer is current. Only one layer can be current at a time. Plot options are applied to only the current layer when you are in the overlay plot mode; you can choose whether view manipulation options are applied to all existing layers or to only the current layer. The current layer is not necessarily the foremost layer in the viewport.
Name
The name of the layer.
Object
The name of the object contained in the layer; for example, an output database or an X–Y plot.
Mode
The plot mode contained in the layer. You cannot change the plot mode after you have created a layer.