An X–Y data object is a collection of ordered pairs that ABAQUS/CAE stores in two columns—an X-column and a Y-column. The X–Y data can originate from an output database or an ASCII file, or you can enter the data using the keyboard. In addition, you can derive X–Y data by combining existing X–Y data objects. For example, you might combine an X–Y data object containing stress values versus time with a second X–Y data object containing strain values versus time to produce an X–Y data object containing stress versus strain at equivalent times. You can save X–Y data objects for the duration of the session; and you can edit, copy, rename, and delete them. In addition, you can copy X–Y data objects to an output database file so that they will be available in subsequent ABAQUS sessions.
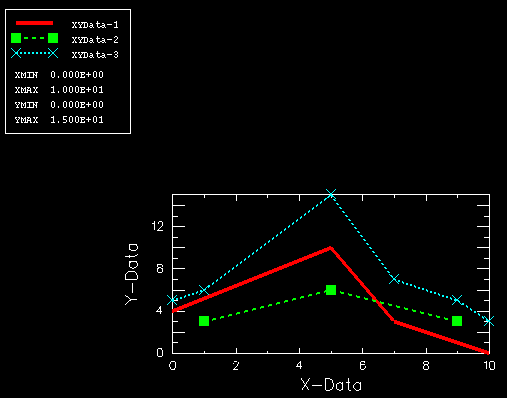
ABAQUS/CAE can display X–Y data in the form of an X–Y plot. An X–Y plot is a two-dimensional graph of one variable versus another. Examples of X–Y plots include temperature versus time, load versus displacement, and stress versus strain. You can display multiple X–Y data objects in one X–Y plot, and you can use the customization options to control the appearance of each data object and the overall appearance of the X–Y plot. Figure 30–1 shows an X–Y plot displaying three X–Y data objects.