Presented here is a dataset used for our SCADA cybersecurity research. The dataset was built using our SCADA system testbed described in [1]. The purpose of our testbed was to emulate real-world industrial systems closely. It allowed us to carry out realistic cyber-attacks.
In this study, our focus was on reconnaissance attacks where the network is scanned for possible vulnerabilities to be used for later attacks. We used scan tools to inspect the topology of the victim network (in this case, our testbed), and identify the devices in the network as well as their vulnerabilities. The attacks carried out against our testbed are described in Table 1, and the details of the commands used to perform the attacks can be found in [2,3].
| Attack Name | Attack Description |
|---|---|
| Port Scanner [2] | This attack is used to identify common SCADA protocols on the network. Using Nmap tool, packets are sent to the target at intervals, which vary from 1 to 3s. The TCP connection is not fully established so that the attack is difficult to detect by the rules. |
| Address Scan Attack [2] | This attack is used to scan network addresses and identify the Modbus server address. Each system has only one Modbus server and disabling this device would collapse the whole SCADA system. Thus, this attack tries to find the unique address of the Modbus server so that it can be used for further attacks. |
| Device Identification Attack [2] | This attack is used to enumerate the SCADA Modbus slave IDs on the network and to collect additional information such as vendor and firmware from the first slave ID found. |
| Device Identification Attack (Aggressive Mode) [2] | This attack is similar to the previous attack. However, the scanning uses an aggressive mode which means that the additional information about all slave IDs found in the system is collected. |
| Exploit [3] | Exploit is used to read the coil values of the SCADA devices. The coils represent the ON/OFF status of the devices controlled by the PLC, such as motors, valves, and sensors [3]. |
All network traffic (normal and abnormal traffic) was monitored by the Audit Record Generation and Utilization System (ARGUS) tool [4]. The monitored traffic is captured and stored in a "csv" file. Table 2 presents the statistical information on the captured network traffic (raw data collection).
| Measurement | Value |
|---|---|
| Duration of capture | 25 Hours |
| Dataset size | 627 MB |
| Number of observations | 7,049,989 |
| Percentage of port scanner attacks | 0.0003% |
| Percentage of address scan attacks | 0.0075% |
| Percentage of device identification attacks | 0.0001% |
| Percentage of device identification attacks (aggressive mode) | 4.9309% |
| Percentage of exploiting attacks | 1.1312% |
| Percentage of all attacks (total) | 6.07% |
| Percentage of normal traffic | 93.93% |
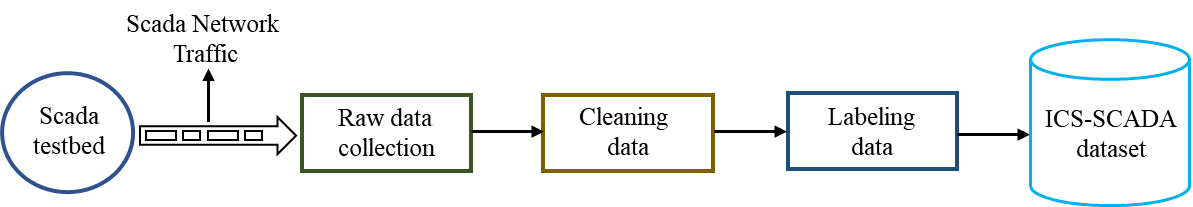
As shown in Table 2, the raw data collection generated a 627 MB dataset, where 93.93% corresponds with the normal traffic (without attacks), and 6.07% corresponds with the abnormal traffic (attack traffic). The raw data has 25 networking features where some features are used in the process of classifying the data, and other features are used to train and test machine learning algorithms. After collecting the data, we started the process of cleaning, classifying and labeling of the dataset. Figure 1 shows the flowchart of the data pre-processing used to prepare the dataset for machine learning.
The data cleaning consists of checking the following common errors:
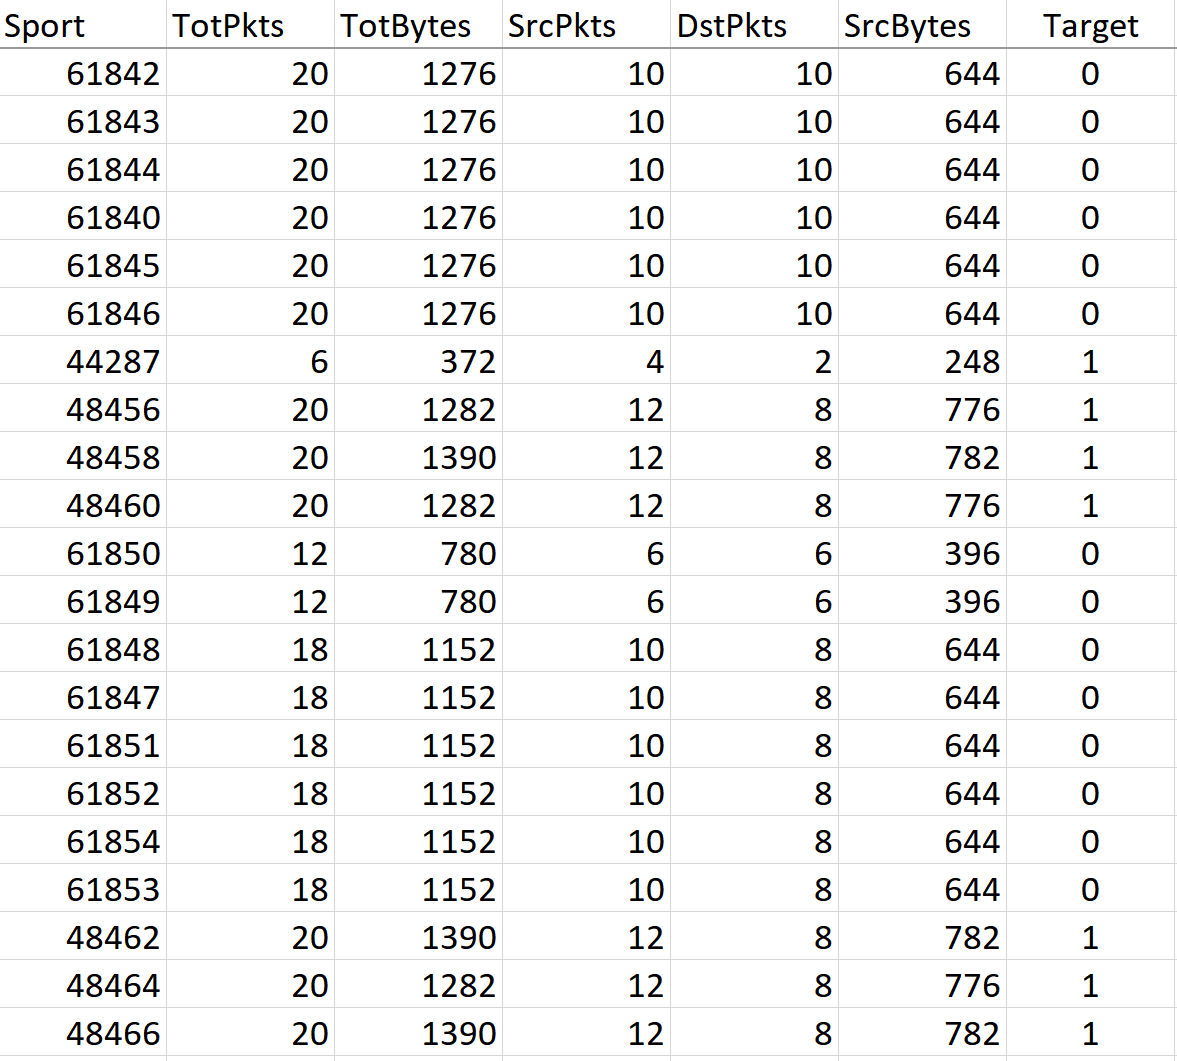
After the process of cleaning data, the number of observations (rows in the dataset) changed to 7,037,983. Each row in the dataset is classified and labeled as normal or attack traffic, depending on the case. So we inserted a column named "Target" in the dataset where the rows with "0" represent the normal traffic, and the rows with "1" represent the attack traffic. In our work, we analyzed the variation of the features during the attack, as well as during the normal traffic (without attack). Based on this analysis, we selected the following features for our dataset as shown in Table 3. Figure 2 illustrates our dataset after the data pre-processing.
| Features | Descriptions |
|---|---|
| Source Port (Sport) | Port number of the source |
| Total Packets (TotPkts) | Total transaction packet count |
| Total Bytes (TotBytes) | Total transaction bytes |
| Source packets (SrcPkts) | Source/Destination packet count |
| Destination Packets (DstPkts) | Destination/Source packet count |
| Source Bytes (SrcBytes) | Source/Destination transaction bytes |
Acknowledgement: This work has been supported under the grant ID NPRP10-0206-170360 funded by the Qatar National Research Fund (QNRF) and grant#2017/01055-4 Sao Paulo Research Foundation (FAPESP). The statements made herein are solely the responsibility of the authors.
References: