| Ramsay Shuck, ramsay.shuck (at) wustl.edu (A paper written under the guidance of Prof. Raj Jain) |
Download |
Abstract
Many parallel programming platforms, such as Cilk Plus, implement a work-stealing scheduler to load-balance parallel computations, since it provides a provably good execution time bound and performs well in practice. However, most work-stealing schedulers, including the Cilk Plus scheduler, do not utilize shared caches and memory efficiently. The Cilk Locality runtime was developed to address the poor locality in the Cilk Plus runtime with the aim of improving overall performance. In this paper, the performance of the Cilk Locality runtime is compared to the Cilk Plus runtime using a number of different metrics. The results show that the Cilk Locality runtime achieves a modest improvement over the Cilk Plus runtime due to improved locality
Keywords: Cilk Plus, Locality, NUMA, Parallel Programming, Work-Stealing, Space-Bounded, Cache, Work Inflation, Performance Analysis, Scheduling.
NUMA is a common memory design choice for multiprocessor systems. Memory is distributed such that a processor has local memory and remote memory to access [Lameter13]. The latency of memory accesses is therefore dependent on whether or not the memory page table resides in local or remote memory [Manchanda12]. This can have major performance implications if a program is repeatedly forced to access remote memory instead of local memory thus making NUMA locality an important consideration.
Cache locality can also impact performance. Cache locality has a spatial and temporal aspect in which spatial locality refers to data use involving memory stored in close locations and temporal locality refers to reuse of data in a short time frame. Improving either increases cache utilization and decreases the average latency of memory accesses [Blelloch04].
The work in this paper examines how both cache and NUMA locality impact the overall performance of benchmarks written in the Cilk parallel programming language. The performance of the Cilk Locality Runtime is compared to the performance of the regular Cilk Runtime to determine if the changes to the locality runtime improve performance. A number of metrics are measured to provide insight into the tradeoffs involved in improving locality.
This introduction has introduced NUMA and cache locality and the next section will cover the two runtimes being evaluated and how they are impacted by locality.
The Cilk Plus runtime is currently developed and maintained by Intel [Intel13] but was originally created by MIT [Frigo98]. The main strength of Cilk is its simplicity. A user simply specifies which functions can be run in parallel with a keyword and the runtime handles all the scheduling. The runtime utilizes a work-stealing scheduling scheme. Cilk threads, otherwise known as workers, are mapped to CPU cores (typically in a one-to-one fashion). Each worker maintains a double-ended queue or deque to store tasks that it isn't currently working on. If a worker finishes its current task, it will attempt to pop off the bottom task of its deque. If there is nothing on its bottom deque, it randomly selects another worker to steal work from. If the worker has tasks to steal, it takes them off the top of their deque. By popping tasks off the bottom of the deque and stealing from the top of other workers' deques, it is able to minimize the required amount of synchronization [Frigo09].
The Cilk Locality Runtime adheres to most of the same principles as the regular Cilk Runtime with a couple of notable changes. One change is that instead of having one deque per worker, it has multiple deques per worker. A deque ostensibly belongs to a level of memory/cache. Tasks are "pinned" to the deque belonging to the corresponding level of memory/cache that is large enough to store its task set. By pinning work to the level of cache/memory that is large enough to store its task set, locality is improved since the possibility that something necessary is evicted from cache/memory is greatly diminished. This property of pinning work based on task set size in order to maximize locality is the space-bounded property [Simhadri14].
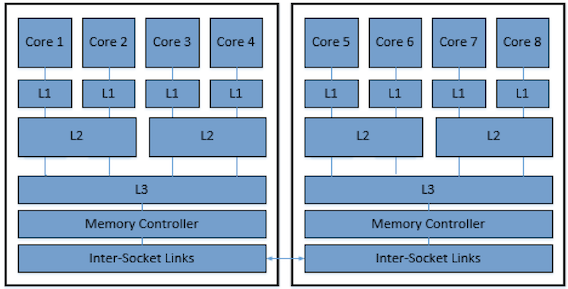
Figure 1: Two Socket Diagram
The second major change is that workers are restricted to stealing tasks from deques with they share cache/memory. If a worker is currently working on the L3 cache level, it can only steal work from other workers with which it shares an L3 cache. This is illustrated in the two socket diagram shown in figure 1. If the worker belonging to core 1 decides to steal at the L3 level, it can only steal from cores 2, 3, and 4 since those are the only cores with which it shares an L3 cache. This further improves locality by avoiding situations in which workers that don't share cache work on subtasks of the same task such as core 1 stealing from core 5 in Figure 1 [Chen14]. These subtasks likely will share variables and data structures so if these workers don't share a cache, data will have to ping-pong between the workers' caches as needed [Chen12]. Whereas if the workers shared a cache, all the data needed by both workers would be available in that cache.
The next section describes how the performance of the runtimes described in this section will be evaluated.
This section lays out what experiments were conducted. It describes which metrics, benchmarks, and workloads were used and explains why they were chosen. All experiments were conducted using a 32 core machine with 4 sockets each with 8 cores. The CPUs in this machine are 2.2 GHz Intel Xeon E5-4620.
The four metrics that were chosen for this evaluation are execution time, work inflation, idle time, and scheduling overhead.
Execution time is the overall time it takes to run the benchmarks. It does not include initialization time, but encompasses everything else pertaining to the running time of the benchmark. The execution time is what will be used to evaluate which runtime is better. The other metrics will be used to analyze the running time, but the running time will ultimately determine which is better.
Work inflation is a measure of how much longer it takes to execute the benchmark in parallel rather than sequentially. It is a measure of the cumulative time spent executing the benchmark and it includes everything except the time spent in the runtime [Acar17]. One factor that could cause work inflation to increase as more cores are used to execute the benchmark is locality. More cores make it more likely that non-local cache and memory accesses will be incurred during the execution. The extra overhead from these accesses could cause an increase in work inflation [Acar17]. We would expect work inflation to be less in the locality runtime due to its improved locality thus making it an interesting point of comparison.
Whereas work inflation relates to time spent executing user code, scheduling overhead and idle time relate to time spent in the runtime. Scheduling overhead is a measure of the total time workers spend on successful steals while idle time measures time spent on failed steals [Acar17]. Both of these measurements should increase in the locality runtime due with the extra overhead to manage multiple deques increasing the scheduling overhead and the stealing restrictions increasing the idle time. If the locality runtime performs worse than the regular runtime, it can likely be attributed to increases in these metrics..
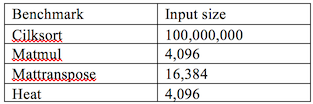
Four benchmarks, each with three different workloads, will be measured. The benchmarks being used are matmul, mattranspose, heat, and cilksort. Matmul performs matrix multiplication in a recursive sub-dividing manner where two randomly generated nxn matrices are multiplied together and the result is stored in a third matrix. The mattranspose benchmark performs a matrix transpose operation and follows a similar recursive sub-dividing scheme as the matmul benchmark. One randomly generated nxn matrix has a transpose operation performed on it and the result is stored in a second matrix. The heat benchmark measures heat diffusion of a matrix of cells also in a recursive subdividing scheme. Two nxn matrices are used to store the results and which matrix holds the current result alternates each iteration. The cilksort benchmark sorts an array of size n using a merge sort approach. Two n size arrays are used in the calculation with the secondary array being used to hold temporary calculations. Three workload sizes are used: small, medium, and large. Table 1 shows what value of n these sizes correspond to for each benchmark.
Table 1: Benchmarks and Workloads
Every benchmark will be tested for both runtimes for 32 workers which is the maximum for this system. Since scalability is a primary concern for this system, using all 32 cores on the system will result in the best comparison point for scalability with this system. Each test will be repeated 5 times and an average will be taken. Measurements for execution time will be conducted separately but measurements for the other three metrics will be conducted simultaneously. The measurements for the other three metrics overlap with the execution time so they need to be measured separately. There isn't such overlap for the other metrics so there should be minimal harm in measuring them together.
This section has described how the experimental evaluation will be conducted while the next section will discuss and analyze the results of the experimental evaluation.
This section graphs and analyzes the execution time data for this experiment. Particular emphasis is placed on the execution time results since they establish which runtime has better overall performance.
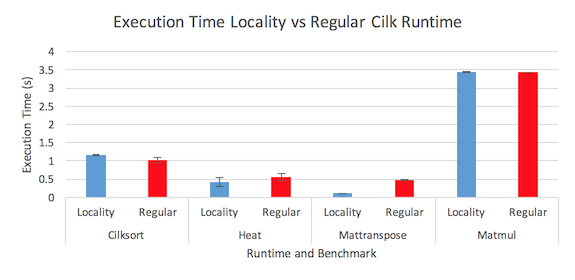
Figure 2: Execution time comparison between the two runtimes
Figure 2 shows the results for the execution time for the two runtimes running all the benchmarks. The error bars represent the 90% confidence interval for the five runs. The results show that although the locality runtime does exhibit a definitive performance improvement for matrix transpose benchmark and minor improvement for the heat benchmark, it exhibits similar performance to the regular runtime for the other two benchmarks. Later analysis of the other three metrics shed some light on this performance difference.
To delve a little deeper into the execution time results, the results were analyzed using the two factor full factorial design with replications analysis. The additive model is used for this data. This is typically avoided for execution time analysis but it works for this data given the small running times.
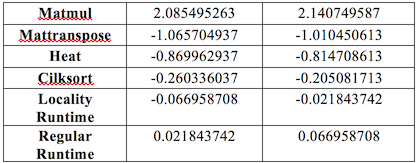
Table 2: Execution time effects
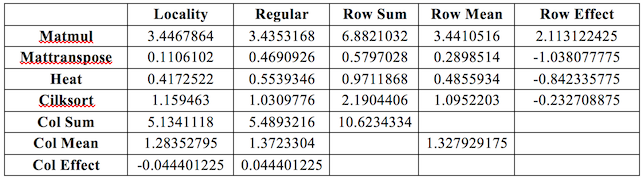
Table 2 displays a calculation of the effects of the benchmarks and runtimes. The effects found in table 2 are used to compute the ANOVA table shown in Table 3.
Table 3: ANOVA table for execution time results
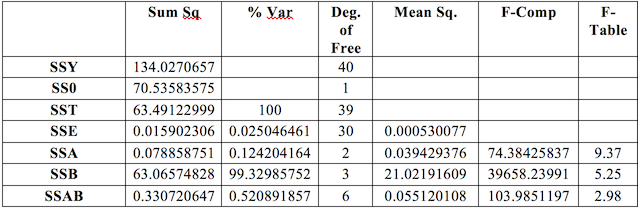
The major surprise from this table is how much the benchmarks influence the variation. The benchmarks are fairly diverse so it is unsurprising that they would influence the results more so than which runtime was used. However, the amount that they contributed is still surprising given the significant differences between the runtimes. The ANOVA table is used to compute the confidence intervals in table 4.
Table 4: 90% Confidence Intervals
The major takeaway from the confidence intervals is that they are all significant. Table 5 shows the confidence interval of the difference between the two runtimes.
Table 5: 90% Contrast Table
![]()
This shows that the locality runtime performance improvement over the regular runtime is significant. However, this improvement is still smaller than anticipated.
Visual tests were conducted to verify the accuracy of the model. Figure 3 shows a predicted response vs error graph.
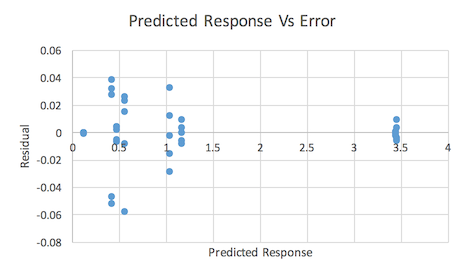
Figure 3: Execution time predicted response vs error
This graph does appear to show a decreasing trend in the errors which is cause for concern. However, given the extremely small size of the errors, it is not unexpected that there would be some sort of trend so this trend does not necessarily warrant concern [Jain91]. Figure 4 shows a QQ Plot.
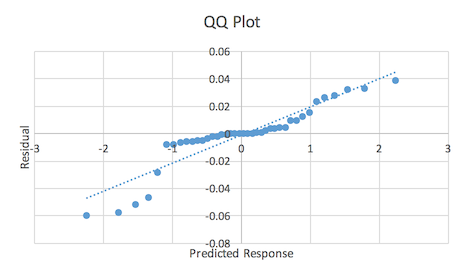
Figure 4: Execution time QQ Plot
The plot does show some deviation from a linear trend at the tails but as with Figure 3, this concern is diminished by the extremely small size of the errors.
This section provided a comprehensive analysis of the execution time results. The next section examines some additional metrics to provide additional information about the strengths and weaknesses of the two runtimes.
Additional metrics were measured to help explain the execution time performance. These metrics provide additional information as to why the locality runtime achieves slightly better performance than the regular runtime but also why this results in only a slight performance improvement.
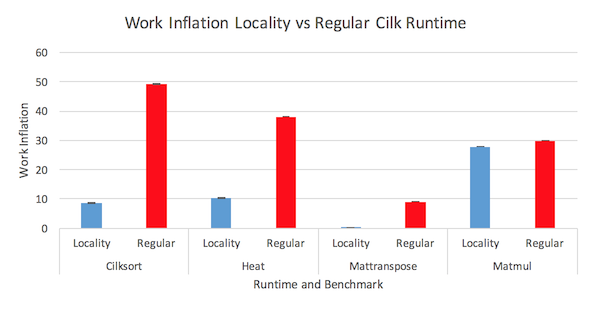
Figure 5: Work inflation measurements for both runtimes
Figure 5 shows the results for the work inflation measurements of both runtimes. The work inflation is calculated by taking the cumulative time the 32 workers spend executing the benchmark code subtracted by the single worker execution time of the benchmark code. These measurements of the benchmark code do not include time spent scheduling the computation in the runtime. The work inflation occurs due to data operations for 32 workers taking more time since the location of the data is distributed across four sockets. As expected, the work inflation is better for locality runtime in all four benchmarks. The enhanced locality of the locality runtime resulted in lower work inflation since the improved locality allowed data accesses to occur more quickly.
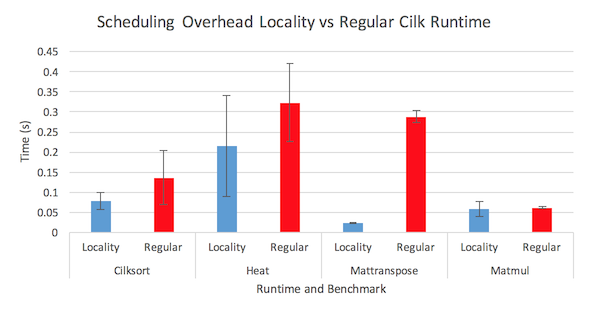
Figure 6: Scheduling overhead comparison between the two runtimes
Figure 6 shows the results for the scheduling overhead measurements of both runtimes. The regular runtime scheduling overhead is worse for all four benchmarks. This contrasts with the hypothesis that the scheduling overhead would be higher due to the added overhead involved in maintaining the multiple level deque structure. My hypothesis for why this diverges with the expected result is that the restricted work stealing reduces the number of successful steals therefore reducing the total measured scheduling overhead. Since the regular runtime has more successful steals, it has higher scheduling overhead even though the time spent on each steal is lower. The large confidence intervals and small measurements do indicate a high variability in these measurements especially for the heat benchmark measurements. Since work stealing is random, this variability is not unexpected.
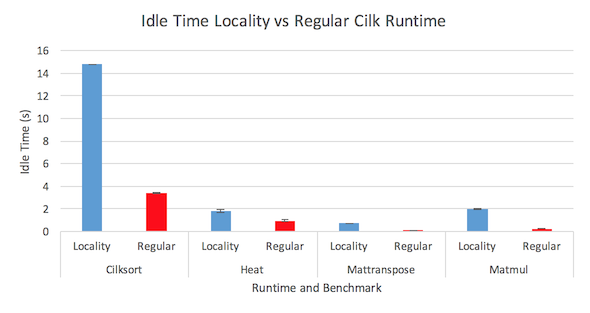
Figure 7: Idle time measurements for both runtimes
Figure 7 shows the results for the idle time measurements of both runtimes. The idle time is noticeably worse for the locality runtime in all four benchmarks. This is most evident in the cilksort benchmark where the locality runtime suffers from extremely high idle time. The locality runtime was expected to do worse since the restricted work stealing scheme increases the probability that a worker will be unable to find work to steal. However, the magnitude of disparity is still surprising given that the distribution of work for these benchmarks should be roughly balanced. Each socket should handle roughly the same amount of work meaning that workers on all four sockets should have work to steal for nearly the entire duration of the execution.
This section has analyzed the findings for each metric measured in this experiment. The next section will summarize these findings and draw conclusions.
The overall results indicate that the locality runtime is slightly better than the regular runtime. The 90% contrast interval was found to be significant for the execution time experiments. The work inflation results show that the locality runtime does exhibit better work inflation than the regular runtime. This supports the hypothesis that the improved locality will result in better work inflation. This is most evident in the cilksort and heat results. This is unsurprising since cilksort and heat appear to be memory bound applications whereas the other benchmarks are more computation bound.
The scheduling time is lower for the locality runtime which is unexpected given the extra overhead required to manage the multiple level deque structure. It appears that the improved scheduling overhead is a result of fewer successful steals in the locality runtime which makes sense given that the restricted work stealing scheme reduces the number of deques from which to steal. The results for the idle time mitigate most of the performance gain from the drop in work inflation and scheduling overhead. This seems to be the reason why the locality runtime does not exhibit significantly improved execution time performance. Lowering the idle time would be a possible way to optimize performance for the locality runtime.
| DEQUE | Double-ended queue |
| L3 | Level 3 (cache) |
| NUMA | Non-uniform memory access |