FootFrame
Contents
Overview
The goal of this project is to develop a system of sensors that can detect and read the amount of force placed on it, each sensor will have a reading for the left and right foot respectively. We plan to do this by using force sensitive resistors to take in data that is sent to arduino, this data will be used to calculate an imbalance (calculation will take place in arduino) in the forces on each sensor, and display this imbalance for the user, we will develop an algorithm as well which will display whether this imbalance is undesirable or okay. In its final state, the project will be able to find imbalances in forces from pushing with the legs when standing or squatting. Applications for FootFrame are found in weightlifting and physical therapy, among other places.
Team Members
- Jessie Korovin
- Adam Messer
- Isabel Shapiro
- Will Luer (TA)
Objectives
- Detect the amount of force applied by feet on force sensitive resistors, up to 110 pounds per foot
- Be able to deliver a reading of the force from each resistor into arduino, and code a program that calculates and displays the difference between the force sensitive resistors in arduino
- Designing a foot stand that allows us to accurately and completely transmit all the force generated by feet onto the force sensitive resistors. Eight force sensors will be used to develop data (this number was chosen to support a Wheatstone bridge circuit)
- Developing an interface to show the information collected (difference in force readings between feet in LBS)
Challenges
- Calibrating force resistors so they do not give inaccurate readings (can sometimes differ by 10%)
- Designing a program to deliver the reading using arduino
- Making sure the foot stands are stable and do not break, to make sure the user remains safe
- Making sure all the force is delivered onto the sensor
- Filtering data to get accurate results
- Ensuring the material that the sensor is housed in will not impact the quality of the data
Gantt Chart
Budget
- 2 SparkFun Load Cell Amplifier - HX711 [$9.95 each] https://www.sparkfun.com/products/13879?_ga=1.121117709.48925135.1486004091
- 2 SparkFun Load Sensor Combinator [$1.95 each] https://www.sparkfun.com/products/13878?_ga=1.52354092.48925135.1486004091
- 8 Load Sensors - 50 kg [$9.95 each] https://www.sparkfun.com/products/10245?_ga=1.9476016.48925135.1486004091
- 9V Battery Clip - [$4.29] https://www.amazon.com/Parts-Express-9V-Battery-Clip/dp/B0002ZPFU8
- 4 pack of 9V D batteries [$8.79] https://www.amazon.com/Duracell-MN-1604-Pack-MN1604/dp/B0164F986Q/ref=sr_1_3_a_it?ie=UTF8&qid=1486762819&sr=8-3&keywords=9v%2Bbattery&th=1
- Arduino (supplied by lab) [$0.00]
- Personal Computer - for display screen and power source - (supplied by group) [$0.00]
- 3D printed load sensor connects [$0.00]
- Wooden platforms and blocks from machine shop [$0.00]
Total
$116.48
Mechanical Design
The main ideas and their corresponding CAD diagrams are drawn out below. The overarching design is for two of the assemblies shown below to exist - one for each foot.
(above)A top-down view of the completed assembly (picturing the foot plate over the base plate). For reasons mentioned below, a team used two rectangular pieces of wood to cover each set of load sensors, rather than circular foot plates.
(above) An isometric view of the assembly, featuring four load sensor support blocks. The foot plate rests evenly upon each of the four load sensors. Not included in the assembly are the four walls that will be set up around the foot plate. These walls will ensure that the foot plate does not move and therefore put more pressure on one sensor than the others. The walls were not included in the above pictures for clarity's sake. The only differentiation between the CAD model and the actual design were the shape of the footplates. Due to an error from a lumber company, the team was unable to received circular footplates. Instead, two pieces of wood were cut to fit across each set of load sensors.
(above) This view is a close up of the load sensor support block and a depiction of the load sensor itself, as well as the load sensor housing. The support block will be attached to the base plate with nails. The housing is two pieces which sandwich the load sensor together. Screws will be put through both pieces and into the support block in order to hold the load sensor in place. These housing pieces are 3D printed. They can be found on the Thingiverse online repository at a link posted below.
Challenges, Modules, and Solutions
Calibration
- To calibrate the project's sensors, a calibration algorithm was found from the sensors' online library.
- Using known weights, the project was able to calibrate the project to an accuracy of .1 pounds.
User Interface
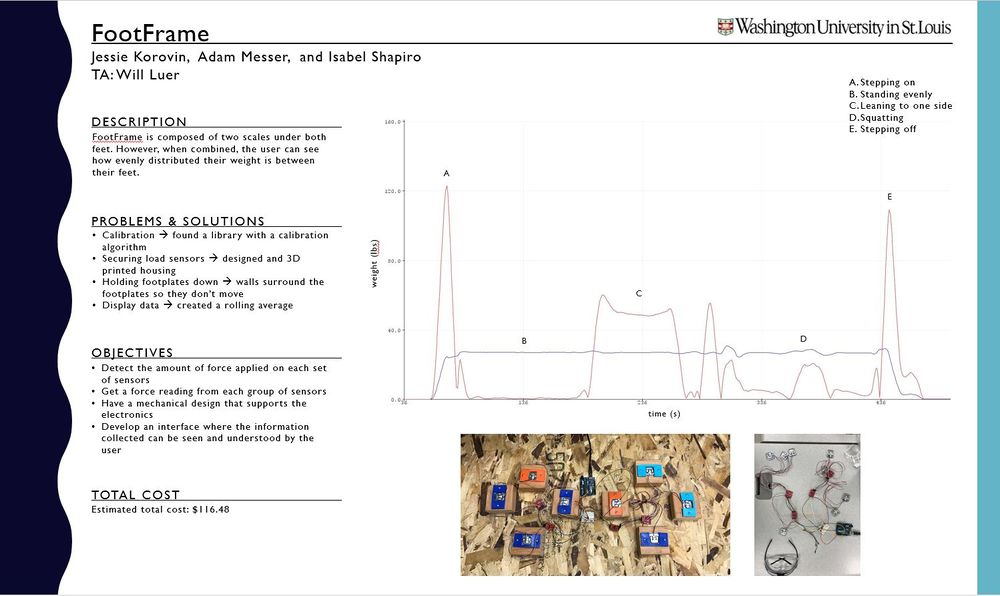
- To display information from the sensors, the project took advantage of the Arduino Serial Plot (an example is below on the poster).
- To simplify the interface, the only information presented during the demo was the difference in weights and a constant of 20% of the user's total bodyweight.
- This 20% constant was given by Dr. Harris of WashU's Biomedical Engineering department as a value considered unhealthy of an individual to surpass while trying to stand or squat. This means that an individual standing or squatting with more than 60% of their bodyweight on one leg or the other is at risk for injury.
Mechanical Design
- The mechanical design had many challenges, one of which was securing the load sensors while not interfering with measurements. This was accomplished through the use of 3D printed sensor housings bolted to blocks that sandwiched the load sensor together and did not apply any force that could misconstrue the readings.
Data Filtering
Results
Repository
Load Sensor CAD Files - http://www.thingiverse.com/thing:2278804


