Google Maps API
1.Before you start, make sure you have a wifi connection, and a google account.
2. In order to use google maps, you are required to use a key, which is provided by google
- In order to access this key go to this website: enabling google maps platform
- Create a project, and set up billing (its free if you use an individual account)
- From this point you will be able to activate your key
3. In order to call the google maps API and visualize a maps display, we can create an HTML file which contains a call to the google maps API
4. To create this HTML file, we will use the following tutorials by google:
Google Maps Javascript API -- Shapes
- If you're just trying to pull up a map of a specific area, the first link is all you will need.
- If you're looking to plot shapes onto the
map you initialize, you will also need to look at the other link.
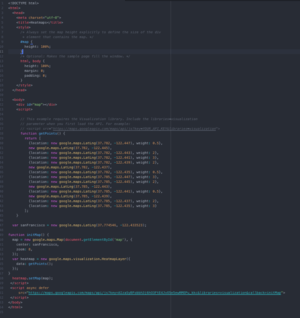
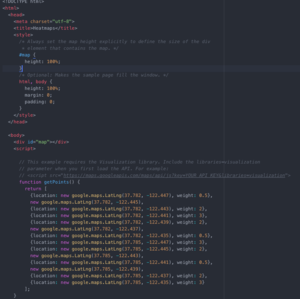
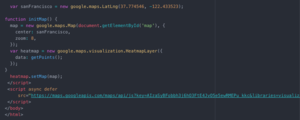
5. Looking at the example code photo on this page (All pictures are from the same code, some are closer up so that it is easier to read the code)
- You can see we initialize the map inside the function (initMap), here you can also add where you want the map to be centered, and the zoom.
- We call the google maps API key inside the "async defer src" script. All you need to do here is copy and paste your key into YOUR_API_KEY in the address: "https://maps.googleapis.com/maps/api/js key=YOUR_API_KEY&callback=initMap"
6. Now you can create a map that is centralized at a specific location. In order to add shapes, you will follow a few more steps:
- For example, if you want to create circles, you need to create circle objects on the map like so:
 var cityCircle = new google.maps.Circle({
     strokeColor: '#FF0000',
     strokeOpacity: 0.8,
     strokeWeight: 2,
     fillColor: '#FF0000',
     fillOpacity: 0.35,
     map: map,
     center: COORDINATES,
     radius: RADIUS
   });
- Similarly, you can do the same with any other shape included in the API (ie rectangles, triangles, polylines). Just follow the 2nd link posted.


