Tool Tracker
Contents
Team Members
Eliot Stein
Zach Steinberg
Hannah Lester
Nathan Schmetter (TA)
Project Description
Tool Tracker is an organization system designed to keep track of the check in/out process of tools in a lab. It involves RFID chips that represent different tools and a software program that monitors the student ID's of people using the tools, the time at which someone checks their tool in/out, which tools are being used, and the rating of each individual tool. Our system is designed to have a simple user experience in which someone could check an item in/out and also see general information about other tools in the lab. This could be used in labs (or any other place that could use a system like this one) to ensure that tools are not damaged or misplaced, and if they are, then the system will be able to determine when and by whom the tool was misplaced and/or damaged.
Challenges
Expected Challenges
Some that challenges we initially anticipated included:
- Connecting the software to the hardware, using RFID chips, and making the check in/check out console.
- Learning how to properly implement our software to meet our desired goals.
- Learning how to use RFID chips and Raspberry Pi.
- After doing some research, it seemed that a common problem with RFID chips is tag collision and reader collision, meaning that signals can accidentally become overlapped. We anticipated having to make sure that this issue did not happen with our tags.
- Making sure that each group member understands the software in its entirety.
Observed Challenges
After the project was completed, we reflected on many of the challenges that we faced. Some of them aligned with what we initially expected and others were different. Our challenges mainly included:
- Making a console that was sized correctly so that all of our hardware could fit inside of it and still be functional.
- We had problems getting the reader to scan, but after a lot of work and research, we were eventually able to make it work.
- We initially struggled with transitions between our different interface pages, but after working with John and doing some trial and error with the coding, we were able to make it so that when a certain button was pressed, the interface would display a new page. Also, we had to make one page transition happen after a tool was scanned, which was the most challenging transition. However, by implementing a "ghost page" in which the code for the scanning function was placed, we were able to make the transition happen.
- The code for the interface pages was written in Python 3, but the code for the scanning was written in Python 2. We had to convert these to be of the same version so that they could work together.
- Once we had the main project completed, we added in text files so that the data could be stored in a separate place. We struggled with updating the text files properly and combining this code with what we had already made. In the end, they worked properly so that they could record when a tool was checked in/out, who had the tools, what time a tool was checked in/out, and its most recent rating (if it was checked in). However, we attempted to create a way to record an average tool rating using data from the text files, but could not properly implement this method.
Materials and Budget
(Please note all prices do not include shipping and handling fees, but the total cost does include this.)
- $22.50 for 10 RFID Tags
- $39.95 for RFID Reader
- $49.99 for 7-inch LCD Touchscreen
- $39.95 for Working RFID Reader
- Raspberry Pi
- 3D Printer Filament
Total Spent: $187.02
Design and Solutions
Module 1: Console
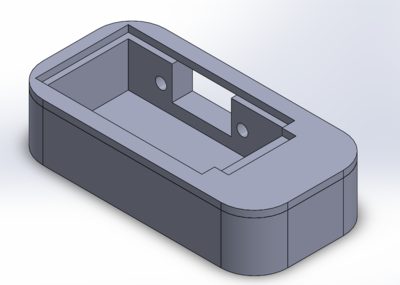
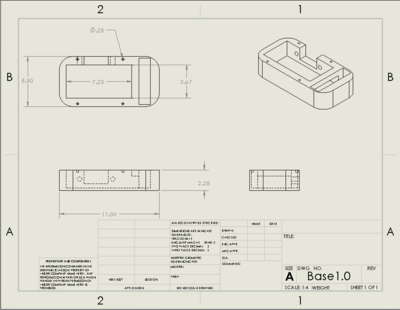
One of the main challenges of this project was creating a console that would be able to house the Raspberry Pi, LCD Screen, NFC Shield, and all of the cables that go with their respective parts. As a team, we did not want the console to be big and bulky, so we needed to create a small and sleek console that had enough room to fit all of the system's parts. Using SolidWorks, we designed two parts for our console; a cover and a base. The dimensions of the console are 11" x 5.50" x 2.75". The cover has a cut-out for the LCD screen and the base is split into two sections. One side of the base houses the Raspberry Pi and the LCD control board. The other side houses the NFC shield. The full SolidWorks assembly and part drawings can be seen below:
Module 2: Attaching NFC shield to the Raspberry Pi
When Attaching the NFC Shield to the Raspberry Pi, we originally soldered the connections using a board to connect them, but the issue that we ran into was that the shield and the board both needed to fit inside of the console. This issue was resolved by neglecting the board and instead using male to female wires to connect the shield directly to the Raspberry Pi. There are 6 different connections needed between the Raspberry Pi and the shield for the shield to function. The pin number I will be referring to is the one on the diagram below. One connection needed to be made between the 5v on the shield and pin 1 (or the 3.3v pin). The second connection was between the ground on the shield and pin 9 on the Pi. The third connection was between the SCK pin on the shield and pin 21. The fourth connection was between the MISO pin on the shield and pin 18 on the Pi. The fifth connection is between the TX (transceiver) on the shield and pin 16 (GPIO pin 23). The final connection was between the RX (receiver) and pin 12 on the shield. Attached below is also a handy wiring chart, but be aware that the shield we used is different from the one used in the chart so the locations of the pins on the shield may be different.
Module 3: Creating the Interface
In order to create the pages for the interface, I downloaded Python and used IDLE to do my coding. I imported Tkinter, which is Python's standard GUI package. To begin learning how this program worked, I followed this tutorial (https://likegeeks.com/python-gui-examples-tkinter-tutorial/) to learn about things such as a window, label, button, radio button, etc. Then, once I understood the general idea of how the code syntax worked, I started working on individual pages for the interface. I made separate files in IDLE, each one representing a different page. These included the Title Page, Check In/Check Out Page, a scanning page, and more. However, these pages were not functional in the beginning. Specifically, even though there were buttons on the pages, nothing actually happened when the buttons were clicked and the pages were in no way connected to each other. Once I thought that all of the main pages were completed, (I had to add in more eventually once the coding progressed) I put all of the separate page files into one full project file that would hold all of the separate pages. The next step that I needed to accomplish was understanding how I could actually make the pages functional and flow together. I tried following tutorials on YouTube and using Stack Overflow to understand how to make this happen, but I was still struggling to understand how this worked. So, I met with John (a TA for this class) to go through one page transition to see how it worked, in hopes that I could use this code to finish the rest of the transitions. We talked about the purpose of the controller, the show method in Python, and how to make buttons function so that when they are clicked, a command is called. Once we went through these ideas, I was able to finish the rest of the transitions. I then had to add more detail to the pages, such as getting a Student ID to display on the screen as someone pressed the numbered buttons, rejecting ID's that were not our own, continuing to add more pages as we realized more of how we wanted the user experience to work, and more. Once I felt that the coding for the interface was complete, it was then time to combine the code that I had written for the pages with the scanning code for the RFID chips.
In the end, the pages were designed well and provided all of the functionality that we needed. In the future, more complex code could make the pages look more visually appealing, but for now, they accomplish the goals set for this project. We had a total of 11 pages, and a description of each page is listed below:
- 1) Opening Page: This is where a user signs into the system with their student ID. This page also has a button that directs you to the Info Page.
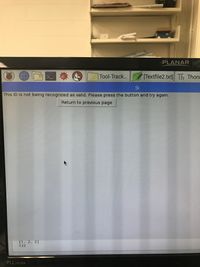
- 2) Reject ID Page: If an entered ID is not already stored in our system as a valid ID, the user will be told to retry their ID.
- 3) Info Page: This displays all 10 tools in the lab, their current status (checked in/out), who has possession of them, and its most recent rating.
- 4) Please Scan Page: Has a button that tells the user to press it, then scan their tool. This button actually directs to the Ghost Page, which has the scanning function. After the tool is scanned, the user will automatically be taken to the page asking if a user is checking a tool in or out.
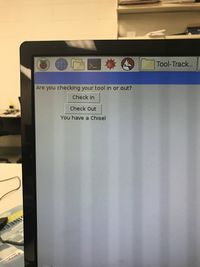
- 5) In or Out Page: Asks a user if they are checking their tool in or out.
- 6) Ghost Page: This page is never actually seen by the user, but this is where the scanning of the ID happens.
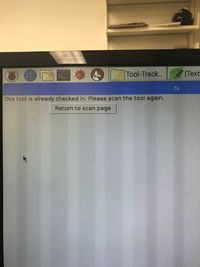
- 7) Already In Page: If a user scans a tool and the system already registers it as being checked in, then they will not be able to check it in again.
- 8) Already Out Page: If a user scans a tool and the system already registers it as being checked out, then they will not be able to check it out again. The layout of this page is almost the exact same as the layout for the "Already In" page as shown above.
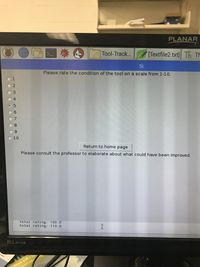
- 9) Experience Page: If a user checks a tool in, the system will ask them how their experience was with the tool. They give it a rating from 1-10 and then receive a message based on this rating.
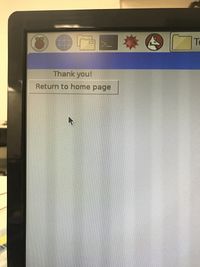
- 10) Thank You Page: If a user checks a tool out, the system thanks them for signing in, and then allows them to return to the home page.
Module 4: ID Analysis
The RFID chips that we used were written to have integer values from 1-10. The tools were identified based on their integer ID value. Each tool has a name, ID, Checked-In/Checked-Out status, user associated with that tool, and a rating. Each of these statuses are held in various arrays throughout our code. When one of these statuses changed, we go through the array and would occupy the status of the array based on the tool's ID value. These arrays helped us store each tool's information while the program was running; however, they would reset and lose all of their information when the program was stopped. In order to solve this problem, we decided the best way to store each tool's information was in text files.
On startup, part of the code looks at what is already in the text file and sets the values in the array for the program to use later on. Later on, those values in the array are manipulated by checking a tool in or out, so that when we change the value in the array, we also rewrite the text file as to copy the array again with the newly changed element. This way, it keeps all of the data about whether a tool is checked in or out and only changes the array term that was already changed. Some issues we faced with the text file are that they need to be preset when the program is run for the very first time as to set a baseline for the code to use. Another issue that we faced was that the text files are not perfect and occasionally spacing issues can cause values to be incorrect, such as putting two IDs on the same line when they should be on separate lines. This can be fixed by manually editing the text file, but we never found a way to get the code to correct automatically for these issues.
Gantt Chart
(Note: The steps listed below was our preliminary idea of how the semester would go, and as the semester went on, we broke these steps down even further and made some changes. We also had to add things that are not currently on this list. The Gantt Chart is a more accurate representation of the steps that we took to complete the project.)
Our main steps will include:
- Learning how to code the Raspberry Pi
- Creating the console using 3D-Printing
- Testing with RFID chips
- Programming the software
- Setting up the server
- Debugging the software
- Connecting the software to the hardware
- Creating the poster
- Demonstration
For the most part, we were able to stay on track with our Gantt Chart. We ran into some technical issues with the reader, which pushed us back slightly. However, once that issue was solved, we got back on track with the original plan. Many of the tasks we accomplished were completed as a group, with one person taking the lead.
Weekly Log
Link To Project Proposal Presentation
Code Explanation and Link to GitHub
The coding that we did for this project was all done in Python. We used Tkinter as a visual interface program that helped us make pages for the screen. This code includes labels, buttons, and many other visual pieces of the interface. We also used source code that we found to help with the scanner. Links to this code can be found in our weekly log. The most challenging element of our coding was combining the code that we made for the interface pages with the scanning code. Also, we initially had a lot of trouble with learning how to code in transitions from one page to another. Once we learned the syntax for one transition, then we were mostly able to mimic this syntax for the rest, with the exception of a few harder transitions.
In addition, we wrote text files that were able to store many pieces of information recorded by our program, such as who checked a certain tool in/out at a certain time, the ratings that tools were given, etc. These are also included in our GitHub. The name of the final file that we used on demo day is called DEMO FILE. This is the final version of our code that we used during the demo. The other version, project.py, was a more preliminary version that we saved to GitHub just incase we didn't get the text files working properly in the demo file, but we did.
There are four text files uploaded on our GitHub, called Textfile2.txt, User.txt, rating.txt, and Status.txt. Textfile2 keeps track of all of the information about the tools, including their ID, who checked them in/out, when the tool was checked in/out, and what rating the tool was given. User is a text file used for the Student ID's. Rating holds the ratings given to tools as they are checked in. Finally, status stores whether a tool is checked in or out.
Results
Demo Day
On the Demo Day, we had our console, screen, a desktop, a keyboard, a mouse, and 10 RFID chips, each labeled as a different tool. The table was set up so that our console was towards the front of the table, allowing people to easily test out the process of scanning tools. We had two different example ID's that people could use if they wanted to check a tool in or out. We began each presentation by explaining the basic premise of Tool Tracker, explaining our process and the different components of our project, including the code, the reader, and the different RFID tags. Then, we asked people if they wanted to try checking a tool in/out, allowing them to see how we intended for the user experience to go. After someone checked a tool in/out, we would direct them to the info page so that they could see that their tool was indeed registered correctly.
We intended to have all of this running on our touchscreen. However, a couple of nights before Demo Day, we realized that our screen was no longer powering on. We think that there was a faulty connection with the wires that could not be fixed, therefore forcing us to use a desktop during the demo. Even though this was not what we had planned on doing, we were still able to show people how this process would work and explained that ideally, they would have a touchscreen to use.
Project Poster
- Please note that the total cost included on the poster only includes the cost of the second reader that we purchased, since this was the only reader included in the final product.
Future Improvements
In the future, there are a few ways in which we could see this project improving. These include:
- Using a functioning touchscreen so that the user could interact with the program through a smaller screen rather than having to use a large desktop.
- Allowing an administrator to have additional privileges, including adding/removing students from the system, adding/removing new tools or old ones that have been replaced, etc.
- Updating a server/using a web application that stores information in the cloud so that more information could be held.
- Having more information available about the tools, such as their overall average rating, a time limit on how long someone could have a tool, etc.
- Adding in a "delete" button onto the interface so that someone could delete a mistyped number when they are entering in an ID. Additionally, we would like to find a way to have the ID clear so that if you return to the home page, there is no ID shown, rather than still showing the previous ID typed.
- Ideally, our system would start on command so that when the Raspberry Pi is plugged in and started, the project files would automatically start running. When we did trials with checking tools in/out, we had to open up the scan file and the project file simultaneously and run them. However, it would be inconvenient for a user to have to do this every time the system is turned on.
