Difference between revisions of "Headband Helper"
(→Links) |
|||
| Line 7: | Line 7: | ||
Accelerometer code [https://github.com/jenfoxbot/ImpactForceMonitor/blob/master/PythonProgram.py] | Accelerometer code [https://github.com/jenfoxbot/ImpactForceMonitor/blob/master/PythonProgram.py] | ||
| + | |||
| + | Final Poster [https://docs.google.com/presentation/d/1YqyF-MSyof1BxPqdG08AN3Ktq9phNsZCDhroIBUUU6o/edit#slide=id.p] | ||
== Project Proposal == | == Project Proposal == | ||
Revision as of 17:43, 19 April 2019
Contents
Links
Presentation [1]
GitHub Repository [2]
Accelerometer code [3]
Final Poster [4]
Project Proposal
Overview
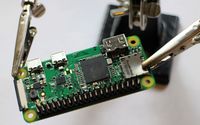
We hope to construct an accelerometer-based concussion monitoring system using a Raspberry Pi OW that can be contained within a headband. In addition, we will create a web interface that allows users to track their impact history. These two pieces (software and hardware) will communicate using an ad hoc IP network run by another Raspberry Pi.
Team Members
- Jarrod Huther
- Katy Mockett
- TA: Ethan Shry
- Professor: James Feher
Objectives
- Create an accelerometer-based concussion monitoring system that can be contained within a headband
- Create an ad hoc IP network using a master Raspberry Pi to collect data from the headbands
- Ensure that the master Pi and web interface can successfully communicate so the web interface can display collected data about collisions
Challenges
- We both have limited experience with circuitry
- We both are comfortable working in Java but have never really used any languages beyond Java
- No experience with sensor networks; creating a fully debugged network will be difficult
Budget
- 2 accelerometers ($11.95 each, $23.90 total)[5]
- Shipping (~$8.00)
- 1 Amp battery & charger ($24.95)[6]
- Raspberry Pi 0W- headband (free)
- Raspberry Pi- master (free)
- 3D box to contain tracking materials within headband (free)
Total Budget: $56.85
Gantt Chart
Design and Solutions
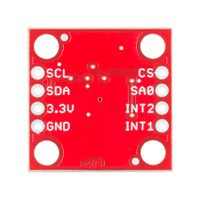
Module 1: Wiring Accelerometer to Pi 0
Module 1 of our project involves wiring the H3LIS331DL accelerometer to the Raspberry Pi 0, as well as implementing the code in python that executes the readings. This specific accelerometer is 3-axis, meaning it records data in the x, y, and z-planes, and can take readings up to +-400g's. We chose this board specifically because concussions occur at approximately 95g's, so we needed a sensor that was capable of sensing events of this magnitude and beyond. Once the sensor was wired to the pi, we had to code the pi to use the sensor, as well as transmit the data to the master pi, in order to read the data on another interface.
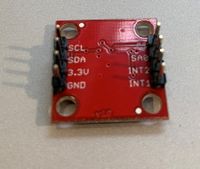
- Step 1: Solder header pins onto both the accelerometer and the pi (if not already attached).
- Step 2: Wire the Pi to the accelerometer as shown in the following diagram. IMPORTANT: The shape of the accelerometer is slightly different, but the pins still go to the corresponding ports (e.g., GROUND will still to GPIO pin 9). Additionally, instead of VCC, connect to the 3.3v port on the accelerometer. Also ignore the LED, we will not be implementing it in our final product.
- Step 3: Code on Pi. Open up the Pi (either SSH or on a monitor) and use this link [7] to import code. Once a file with the code has been made, change the maxScale variable to 400, as well as every instance of 6, 12, and 24 to 100, 200, 400 (respectively). For example, if you see RANGE_6G = 0x00, change it to RANGE_100G = 0x00, and so on. Finally, ((((((TO-DO))))))(function to send data to server)
- Step 4: Build case for pi-accelerometer system (((((TO-DO)))))))
- Step 5: Place in headband (((((TO-DO)))))
Module 2: Build Ad Hoc Network
- API Routes, Sending/receiving data, etc.
- Created Schema for design. Additionally, designed and set up AWS web interface structure, starting with the wireframe and working up(step-by-step and referenced websites can be found in log). Established ad hoc network and set up the pi 3 as an access point/router. Then created database instance and how the data would be displayed. Created API routes for the communication with the pi 0 as well as the other previously mentioned processes.
Module 3: Gather and Interpret Data
- Once data is in the server, read results and draw conclusions. Will do this by testing the system in an experimental setting (lab first, then likely move to field to see how it responds in a practical application). Once data is collected and properly displayed on webpage, we can begin discussion on what certain outputs read, and what constitutes an "event" (possible concussion).
Results
- Present all your results, including modules that only partially worked.
- Discuss how the results compare to your original objectives.
- Identify the critical decisions or factors in your project that stopped you from getting a better result (try to avoid obvious comments such as "we run out of time").
- If the project had any ethical, privacy or safety issues related to it, discuss how you addressed them.
- Include on the main wiki an image of the final project or short video of the working project.
Next Steps
- Make sure to include a "Next Steps" section where you identify the next things you would do if you were to continue the project


