To produce a contour plot, ABAQUS/CAE reads results for the variable and frame you specify from the output database. Results for a particular variable and frame may not be available or may not be applicable for one or more elements included in the plot. You can specify the display color for elements that have no results. The default color is white.
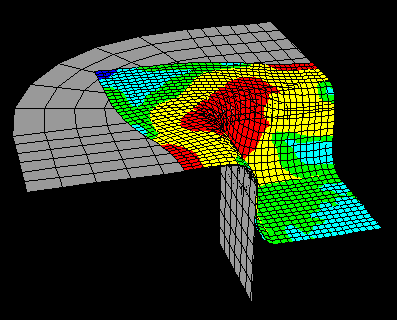
For example, the contour plot in Figure 36–18 shows the von Mises stress generated when a blank sheet is deformed using a die and punch (the punch is not shown in the figure).
In this case the color gray was selected for elements with no results. The die elements appear gray because the die is a rigid surface for which no stress results exist.To color elements with no results:
Locate the Elements with No Results options.
From the main menu bar, select View![]() ODB Display Options. Click the General tab in the dialog box that appears. The Elements with No Results options are in the center of the General page.
ODB Display Options. Click the General tab in the dialog box that appears. The Elements with No Results options are in the center of the General page.
Click the color sample ![]() .
.
ABAQUS/CAE displays the Select Color dialog box.
Use one of the methods in the Select Color dialog box to select a new color. For more information, see “Customizing colors,” Section 3.2.9.
Click OK to close the Select Color dialog box.
The color sample changes to the selected color.
Click Apply to implement your changes.
Elements with no results in contour plots (including display bodies) change to reflect your coloring specification, which is saved for the duration of the session.