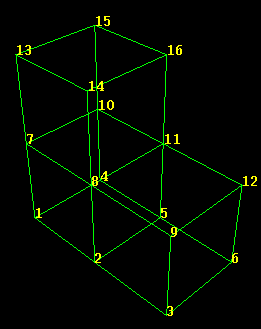
Node labels are numeric labels (node numbers) identifying each node. For example, the nodes are labeled in Figure 36–9.
Node labels are plot state–independent; that is, you set them once for all undeformed, deformed, contour, symbol, and material orientation plots. You can also set the node labels that ABAQUS/CAE will display on the undeformed shape when the deformed shape is superimposed on it. Toggle Show node labels to display or suppress node labels and to choose their color.
To customize node labels:
Locate the common or superimposed node label options. The common node label options always apply to the deformed shape; they apply to the undeformed shape when it is plotted individually in any plot state (undeformed, deformed, contour, symbol, or material orientation). When the undeformed shape is plotted with the deformed shape, the superimpose node label options apply.
From the main menu bar, select Options![]() Common or Superimpose; then click the Labels tab in the dialog box that appears.
Common or Superimpose; then click the Labels tab in the dialog box that appears.
Toggle Show node labels to display or suppress numeric node labels.
When Show node labels is on, the node label color options become available.
Choose the color of the node labels:
Click the color sample ![]() .
.
ABAQUS/CAE displays the Select Color dialog box.
Use one of the methods in the Select Color dialog box to select a new color. For more information, see “Customizing colors,” Section 3.2.9.
Click OK to close the Select Color dialog box.
The color sample changes to the selected color.
Click Apply to implement your changes.
The labels change according to your specification.
Your changes are saved for the duration of the session and will affect all subsequent plots in the current viewport and in any new viewports created from the current viewport.