Figure 32–2 shows an example of a stress line defined for an axisymmetric model of a pressure vessel.
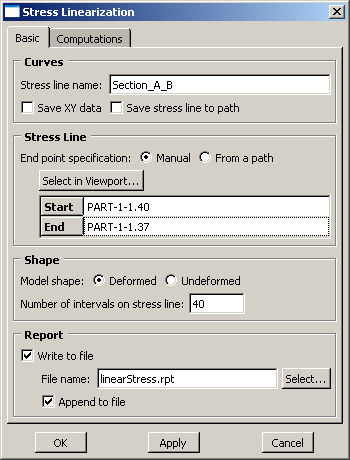
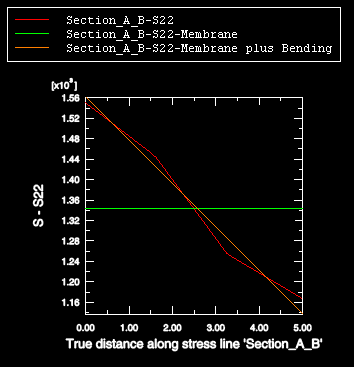
The stress line Section_A_B is defined through the vessel wall. Figure 32–3 and Figure 32–4 show the basic settings and computations, respectively, that you use to linearize the S22 stress component for the undeformed model shape. When you click OK or Apply in the Stress Linearization dialog box, ABAQUS/CAE creates an X–Y plot of the S22 stress component (oriented normal to the stress line) and of the resulting linearized stresses, as shown in Figure 32–5. The following output is also written to a file called linearStress.rpt:********************************************************************************
Statically Equivalent Linear Stress Distribution across a Section,
written on Thu Sep 08 13:16:29 2005
Source
-------
ODB: Job-1.odb
Step: Step-1
Frame: Increment 1: Step Time = 1.000
Linearized Stresses for stress line 'Section_A_B'
X Y Z XY Shear
Stress Stress Stress Stress
Membrane
(Average) Stress -253.25 1342.83 1317.87 62.6914
Bending
Stress, Point 1 -209.126 218.605 140.32 0
Membrane plus
Bending, Point 1 -462.376 1561.43 1458.19 62.6914
Bending
Stress, Point 2 184.48 -206.046 -140.32 0
Membrane plus
Bending, Point 2 -68.77 1136.78 1177.55 62.6914
Peak Stress,
Point 1 0 -11.2393 -7.44218 12.0759
Peak Stress,
Point 2 0 30.1772 20.4924 -19.5983
-------------------------------- INVARIANT RESULTS --------------------------
Bending components in equation for computing
membrane plus bending stress invariants are: S22
Max. Mid. Min. Tresca Mises
Prin. Prin. Prin. Stress Stress
Membrane
(Average) Stress 1345.29 1317.87 -255.709 1601 1587.47
Membrane plus
Bending, Point 1 1563.6 1317.87 -255.413 1819.01 1709.45
Membrane plus
Bending, Point 2 1317.87 1139.6 -256.072 1573.95 1492.82
Peak Stress,
Point 1 132.878 -10.5051 -209.861 342.738 298.137
Peak Stress,
Point 2 186.93 27.7269 -119.828 306.758 265.724The Y Stress corresponds to the S22 stress shown in Figure 32–5. The actual stress values plotted in the curve Section_A_B_S22 do not appear in the report. The linearized membrane and membrane-plus-bending stress curves are generated from the values shown for Y Stress. The reported invariants are calculated from the selected linearized components.