When you display a vector variable in a symbol plot, you can choose from the following options:
Display arrows that represent resultant values of the variable. For example, a symbol plot of total displacement appears on the left side of Figure 27–2.
Display arrows that represent specific component values of the variable. For example, a symbol plot of displacement in the 1-direction appears on the right side of Figure 27–2.
Likewise, when you display a tensor variable in a symbol plot, you can choose from the following options:
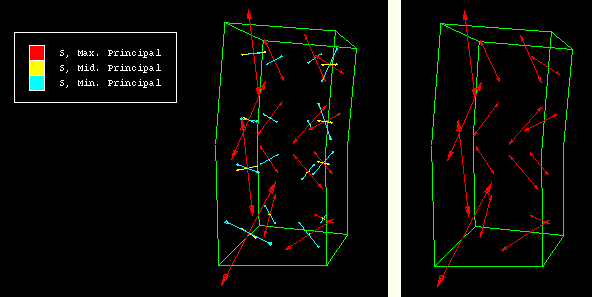
Display arrows that represent each of the principal components of the variable. For example, a symbol plot of maximum, middle, and minimum principal stress appears on the left side of Figure 27–3.
Display arrows that represent a specific principal component of the variable. For example, a symbol plot of only maximum principal stress appears on the right side of Figure 27–3.
Figure 27–3 Symbol plot showing all three principal components (left), and symbol plot showing only maximum principal stress (right).
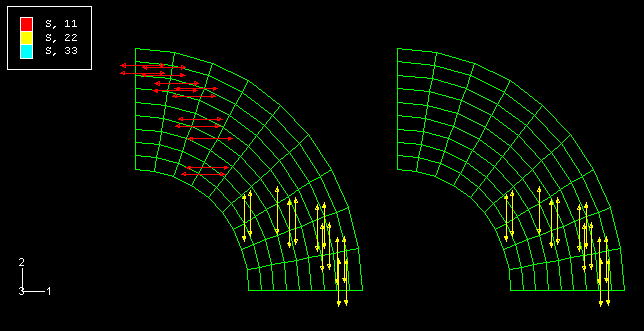
Display arrows that represent each of the direct components of the variable. For example, a symbol plot of all direct components appears on the left side of Figure 27–4.
Display arrows that represent a specific direct component of the variable. For example, a symbol plot of only S22 appears on the right side of Figure 27–4.
Figure 27–4 Symbol plot showing all direct components (left), and symbol plot showing only S22 (right).
By default, ABAQUS/CAE displays resultant values in vector variable symbol plots and all principal components in tensor variable symbol plots. If you want to display a specific variable component, you must specify options in both the Symbol Plot Options dialog box and the Field Output dialog box.
To plot a particular variable or variable component:
Locate the vector or tensor Color & Style options.
Select Options![]() Symbol from the main menu bar or click
Symbol from the main menu bar or click ![]() in the toolbox; then click the Color & Style tab in the dialog box that appears. The Color & Style options appear.
in the toolbox; then click the Color & Style tab in the dialog box that appears. The Color & Style options appear.
Click the Vector tab if you are creating a vector symbol plot.
Click the Tensor tab if you are creating a tensor symbol plot.
Click the arrow next to the Quantity field, and select the option of your choice.
If you are creating a vector plot
Select Resultant to display arrows that represent the resultant of the variable.
Select Selected Component to display arrows that represent a particular component of the variable.
If you are creating a tensor plot
Select All Principal Components to display arrows that represent all three principal components: maximum, middle, and minimum.
Select Selected Principal Component to display only arrows that represent a particular principal component.
Select All Direct Components to display arrows that represent all three direct components.
Select Selected Direct Component to display only arrows that represent a particular direct component.
Click Apply to implement your changes.
Your changes are saved for the duration of the session and will affect all subsequent symbol plots.
Select the variable or variable component of your choice in the Field Output dialog box. For more information, see “Selecting the primary field output variable,” Section 24.4.2.