Symbol plots allow you to visualize the magnitude and direction of vector and tensor variable results. Each vector and tensor result value appears as an arrow drawn at the location in the model where the result was obtained; arrows representing nodal quantities appear at nodes, and arrows representing integration point quantities appear at integration points. (You cannot create a symbol plot of element quantities stored at nodes.)
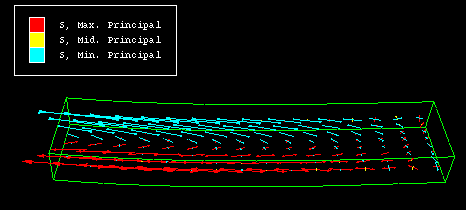
For example, a symbol plot of the principal stress tensor is shown in Figure 27–1.
The relative sizes of the arrows indicate the magnitude of the result values. The directions of the arrows indicate the global directions of the results. In tensor plots arrows with arrowheads pointing in toward the arrow shaft represent compressive values; arrows with arrowheads pointing out from the arrow shaft represent tensile values.
The symbol plot legend shows you how each arrow color corresponds to a specific variable or variable component. To learn how to display the minimum and maximum values associated with your symbol plot, see “Customizing the legend,” Section 37.1.
By default, ABAQUS/CAE plots all of a variable's result values in a symbol plot. The maximum value appears as the largest arrow in the plot, and all other arrows are scaled in proportion to that arrow size. However, you can use the Symbol Plot Options dialog box to limit the range of values that appear in a plot.
When you specify a particular maximum value, only arrows representing absolute values less than or equal to that maximum value appear in the plot.
The largest arrow in the plot will represent the largest absolute result value that is less than or equal to the limit you specify. All other arrows in the plot will be scaled in proportion to that arrow size.
When you specify a particular minimum value, only arrows representing absolute values greater than that minimum value appear in the plot.