
ABAQUS/CAE displays connectors modeled using connector section assignments in the Visualization module. You can control the display of connectors using display groups. Each connector is listed as an element set in the output database. For more information on display groups, see “Creating or editing a display group,” Section 52.2.1.
You can also use the Entity Display options in the ODB Display Options dialog box to control the display of symbols that represent connectors. You can control the following:
The highlighting of wire endpoints
The display of local connector orientations
The display of connector type labels
The size of the displayed symbols
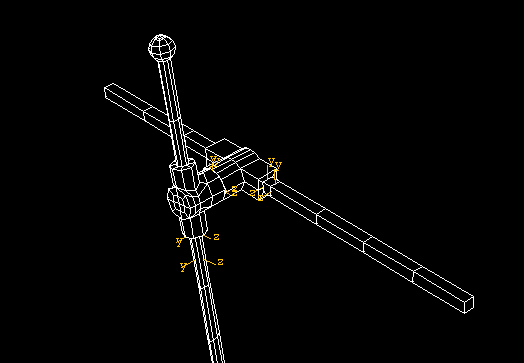
For example, you can use display groups to display four part instances and three connector element sets of the crank mechanism, as shown in Figure 21–8.
Figure 21–8 Selected part instance, connector, and connector symbol display in the Visualization module for the crank mechanism.
For information on plotting connector output results, see Chapter 29, “X–Y plotting.”