The Results Tree provides a visual description of the output data available in your session, including all open output databases and session-specific data such as X–Y data and X–Y plots. This tool shares the left side of the ABAQUS/CAE interface with the Model Tree, and you can click the Model or Results tab to toggle the display between the Model Tree and the Results Tree. The Results Tree also uses all of the same keyboard and navigational shortcuts as the Model Tree; see Table 3–2 for more information.
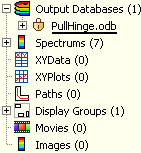
Figure 3–23 shows the appearance of the Results Tree after completing an analysis of the tutorial for the hinge model in Appendix C, “Using Additional Techniques to Create and Analyze a Model in ABAQUS/CAE,” of Getting Started with ABAQUS.
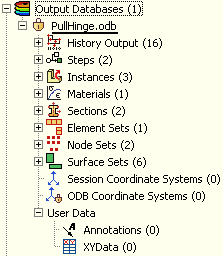
The Output Databases container displays all the output database files that are currently open in your session. In the example shown in Figure 3–23 the Output Databases container is expanded and reveals that only one output database is open—the PullHinge output database.Expanding PullHinge, as shown in Figure 3–24, reveals that this output database has eight containers—History Output, Steps, Instances, Materials, Sections, Element Sets, Node Sets, and Surface Sets. In addition, the output database contains two empty containers—Session Coordinate Systems and ODB Coordinate Systems. You cannot delete an empty container from the Results Tree.
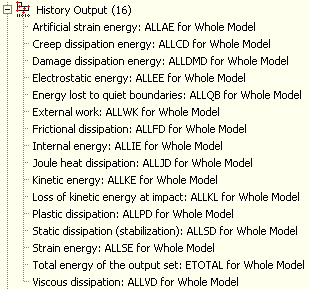
Expanding the History Output container, as shown in Figure 3–25, reveals the sixteen output variables for which history output was requested in this analysis. Each variable listing also describes the region for which history output was requested; in this example every history output request was made for the whole model. You can click any of the history output variables in the Results Tree to plot the selected variable in the current viewport.
Each output database also includes a Steps container, which includes containers for each step in the output database and within the steps, every frame in the output database. You can use the Results Tree to display the model at any frame of the analysis, to activate or deactivate steps or frames in the analysis, or to display field output at the selected frame.
The other containers in the Results Tree provide shortcuts to data that persist only during your session. By using these shortcuts, you can create and manage contour spectrums; create and edit X–Y data and display X–Y plots, create and manage paths and display groups; and upload and display background images and movies.