Product: ABAQUS/CAE
Benefits: The adaptivity plotter plug-in enables you to plot the error indicator norms from an adaptivity analysis. The resulting plot allows you to view a graphical representation of the effectiveness of the adaptive remeshing process.
Description: When you execute an adaptivity analysis, ABAQUS/CAE submits a succession of ABAQUS/Standard jobs as it attempts to reduce the mesh discretization error in your model. This error is characterized by error indicator measures calculated byABAQUS/Standard. Global norms of these indicators are calculated by ABAQUS/CAE, and you can use these norms to evaluate the performance and effectiveness of the adaptive remeshing process.
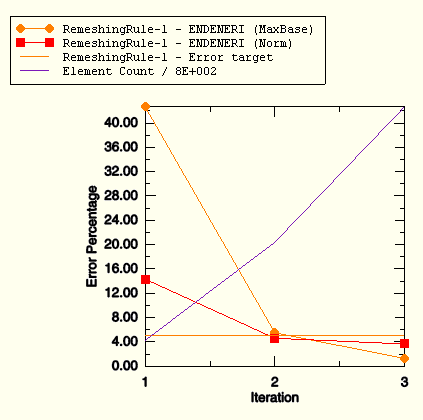
The adaptivity plotter plug-in enables you to plot the value of these error indicator norms for each iteration as the analyses progresses. An example of an X–Y plot created by the plug-in is shown in Figure 13–1.
All modules: Plug-insTools