Graphical postprocessing is important because of the great volume of data created during a simulation. ABAQUS/Viewer allows you to view the results graphically using a variety of methods, including deformed shape plots, contour plots, symbol plots, animations, and X–Y plots. All of these methods are discussed in this guide. For more information on any of the postprocessing features discussed in this guide, consult the sections on the Visualization module in the ABAQUS/CAE User's Manual. For this example you will use ABAQUS/Viewer to do some basic model checks and to display the deformed shape of the frame.
Start ABAQUS/Viewer by typing
abaqus viewerat the operating system prompt. The ABAQUS/Viewer window appears.
Reading the output database file
To begin this exercise, open the output database file that ABAQUS/Standard generated during the analysis of the problem.
To open the output database file:
From the main menu bar, select File![]() Open; or use the
Open; or use the ![]() tool in the toolbar.
tool in the toolbar.
The Open Database dialog box appears.
From the list of available output database files, select frame_xpl.odb.
Click OK.
Tip: You can also open the output database frame.odb by typing
abaqus viewer odb=frame_xplat the operating system prompt.
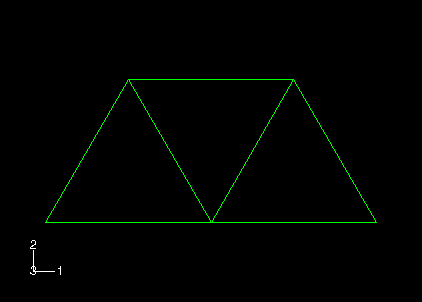
ABAQUS/Viewer opens the output database created by the job and displays the undeformed model shape, as shown in Figure 2–13.
The title block at the bottom of the viewport indicates the following:
The description of the model (from the first line of the *HEADING option in the input file).
The name of the output database (from the name of the analysis job).
The product name (ABAQUS/Standard or ABAQUS/Explicit) and version used to generate the output database.
The date the output database was last modified.
Which step is being displayed.
The increment within the step.
The step time.
The Results Tree
You will use the Results Tree to query the components of the model. The Results Tree allows easy access to the history output contained in an output database file for the purpose of creating X–Y plots and also to groups of elements, nodes, and surfaces based on set names, material and section assignment, etc. for the purposes of verifying the model and also controlling the viewport display.
To query the model:
In the left side of the main window, click the Results tab to switch to the Results Tree.
All output database files that are open in a given postprocessing session are listed underneath the Output Databases container. Expand this container and then expand the container for the output database named frame_xpl.odb.
Expand the Materials container and click the material named STEEL.
All elements are highlighted in the viewport because only one material assignment was used in this analysis.
The Results Tree will be used more extensively in later examples to illustrate the X–Y plotting capability and manipulating the display using display groups.
Customizing an undeformed shape plot
You will now use the plot options to enable the display of node and element numbering. Plot options that are common to all plot types (undeformed, deformed, contour, symbol, and material orientation) are set in a single dialog box. The contour, symbol, and material orientation plot types have additional options, each specific to the given plot type.
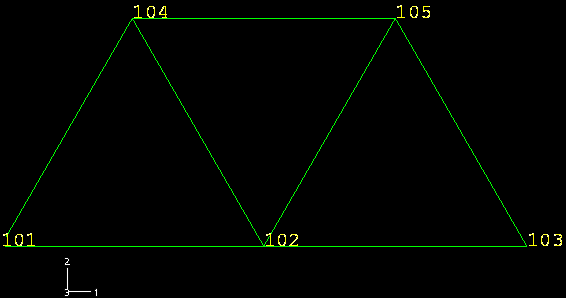
To display node numbers:
From the main menu bar, select Options![]() Common, or use the
Common, or use the ![]() tool in the toolbox.
tool in the toolbox.
The Common Plot Options dialog box appears.
Click the Labels tab.
Toggle on Show node labels.
Click Apply.
ABAQUS/Viewer applies the change and keeps the dialog box open.
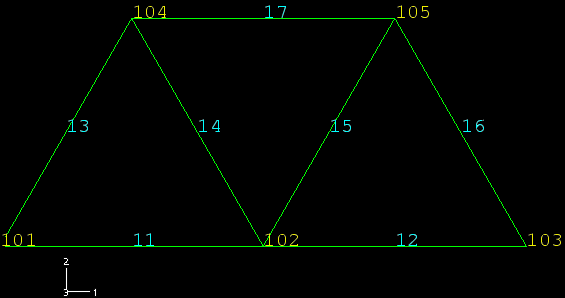
To display element numbers:
In the Labels tabbed page of the Common Plot Options dialog box, toggle on Show element labels.
Click OK.
ABAQUS/Viewer applies the change and closes the dialog box.
To disable the display of node and element numbers, repeat the above procedure and, under Labels, toggle off Show node labels and Show element labels.
Displaying and customizing a deformed shape plot
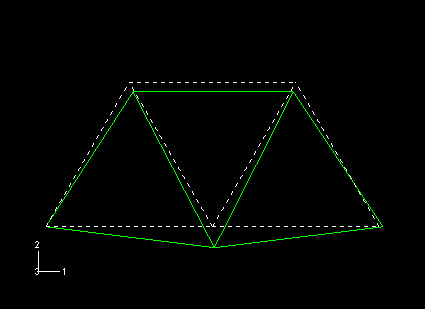
You will now display the deformed model shape and use the plot options to change the deformation scale factor and overlay the undeformed model shape on the deformed model shape.
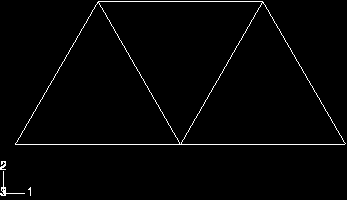
From the main menu bar, select Plot![]() Deformed Shape; or use the
Deformed Shape; or use the ![]() tool in the toolbox. ABAQUS/Viewer displays the deformed model shape, as shown in Figure 2–16.
tool in the toolbox. ABAQUS/Viewer displays the deformed model shape, as shown in Figure 2–16.
The scale factor for the deformed plot is displayed in the state block. By default, the displaced shape is not scaled. For this analysis, change the deformation scale factor so that the displaced shape is evident.
To change the deformation scale factor:
From the main menu bar, select Options![]() Common, or use the
Common, or use the ![]() tool in the toolbox.
tool in the toolbox.
From the Common Plot Options dialog box, click the Basic tab if it is not already selected.
From the Deformation Scale Factor area, toggle on Uniform and enter 40.0 in the Value field.
Click OK to redisplay the deformed shape.
The plot title displays the new scale factor.
To superimpose the undeformed model shape on the deformed model shape:
Click the ![]() tool in the toolbox to allow multiple plot states in the viewport, then click the
tool in the toolbox to allow multiple plot states in the viewport, then click the ![]() tool or select Plot
tool or select Plot![]() Undeformed Shape to add the undeformed shape plot to the existing deformed plot in the viewport.
Undeformed Shape to add the undeformed shape plot to the existing deformed plot in the viewport.
By default, ABAQUS/Viewer plots the deformed model shape in green and the (superimposed) undeformed model shape in a translucent white (appears gray).
The plot options for the superimposed image are controlled separately from those of the primary image. From the main menu bar, select Options![]() Superimpose; or use the
Superimpose; or use the ![]() tool in the toolbox to suppress the translucency of the superimposed (i.e., undeformed) image.
tool in the toolbox to suppress the translucency of the superimposed (i.e., undeformed) image.
From the Superimpose Plot Options dialog box, click the Other tab.
In the Other tabbed page, select the Translucency tab.
Toggle off Apply translucency.
Click Apply to apply the changes.
To change the undeformed model shape's line style:
From the Superimpose Plot Options dialog box, click the Color & Style tab.
In the Edge Attributes area, choose the dotted line style.
Click OK.
To return the undeformed plot's line style to solid, repeat the above procedure and select the solid line style. Alternatively, to return all the undeformed plot options to their default values, you can click Defaults in the Superimpose Plot Options dialog box.
Checking history data with ABAQUS/Viewer
By default, both the model data and history data are written to the output database file during the datacheck phase. Thus, you can use ABAQUS/Viewer to check that the input data are correct before running the simulation. You have already learned how to draw plots of the model and to display the node and element numbers. These are useful tools for checking that ABAQUS is using the correct mesh.
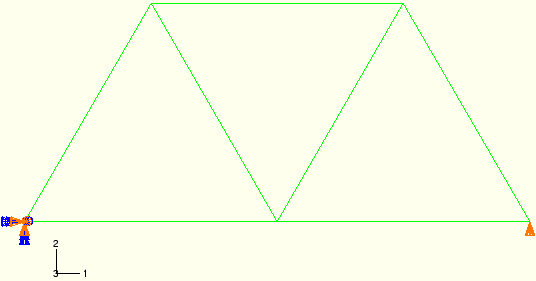
The boundary conditions applied to the overhead hoist model can also be displayed using ABAQUS/Viewer.
To display boundary conditions on the undeformed model:
From the main menu bar, select Plot![]() Undeformed Shape; or use the
Undeformed Shape; or use the ![]() tool in the toolbox.
tool in the toolbox.
From the main menu bar, select View![]() ODB Display Options.
ODB Display Options.
In the ODB Display Options dialog box, click the Entity Display tab.
Toggle on Show boundary conditions.
Click OK.
Exiting ABAQUS/Viewer
From the main menu bar, select File![]() Exit to exit ABAQUS/Viewer.
Exit to exit ABAQUS/Viewer.