You can display a plot of your model showing the deformed shape during each frame of the analysis. When you request a deformed shape plot of data from a force-displacement analysis, ABAQUS plots the nodal displacements by default; but you can display any nodal vector field output variable that is available on the output database. You can also use the plot options to customize the appearance of a deformed plot.
Most procedures in ABAQUS/Standard or ABAQUS/Explicit write displacement to the output database by default and also select displacement for the nodal vector quantity to use as the default deformed variable. When ABAQUS reads the output database, it uses the default deformed variable to determine the shape of a deformed plot. In the elastomeric block example the user requested output of the displacements (U) for every node in the model after every 10 increments, and displacement was selected as the default deformed variable.
(Some procedures—for example, heat transfer—do not write nodal vector quantities to the output database by default and do not select a variable as the default deformed variable. Therefore, ABAQUS cannot display a deformed plot, since in such cases the output database does not contain any variables that can be used to compute a deformed shape.)
To display a deformed shape plot:
From the main menu bar, select Plot![]() Deformed Shape.
Deformed Shape.
Tip:
You can also plot the deformed model using the ![]() tool in the Visualization module toolbox.
tool in the Visualization module toolbox.
ABAQUS displays the deformed model in the same increment and step that it last displayed the undeformed model. The element labels also appear because the common plot options were used to display them.
Open the Common Plot Options dialog box. Click Defaults to restore the default options.
The state block indicates the default deformed variable being plotted (U) and the deformation scale factor (1.000e+00). ABAQUS selects a default deformation scale factor of 1.0 for large-displacement analyses. (For small-displacement analyses ABAQUS chooses the default scale factor to fit the viewport optimally.)
The buttons in the context bar allow you to move between frames of the analysis. In particular, the button on the far right of the context bar is the frame selector ![]() tool; it allows you to drag a slider to choose the frame of interest.
tool; it allows you to drag a slider to choose the frame of interest.
You can also move directly to a selected step and increment using the following technique:
From the main menu bar, select Result![]() Step/Frame.
Step/Frame.
ABAQUS displays the Step/Frame dialog box.
Select Step 1, Increment 0, and click Apply.
The Step/Frame dialog box also displays the step time associated with an increment. Use the Step/Frame dialog box to display the deformed model approximately halfway through the second step.
Use a combination of the buttons in the context bar and the Step/Frame dialog box to view the deformed plot in different frames and in different steps.
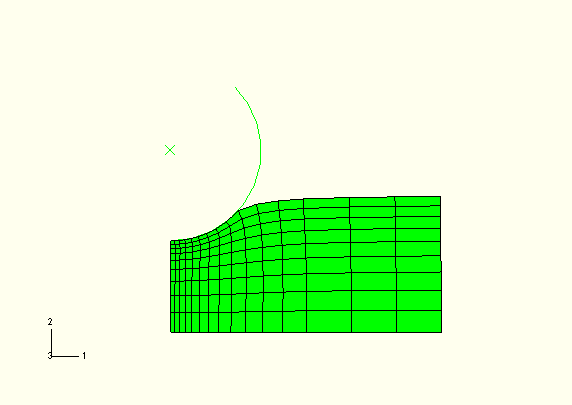
Display the deformed model after the last increment of the third step (Step 3 and Step Time = 10.00), as shown in Figure D–3.
Click Cancel to close the Step/Frame dialog box.
You can plot the undeformed and deformed model shapes simultaneously.
To plot the undeformed and deformed model shapes:
Click the ![]() tool in the toolbox to allow multiple plot states in the viewport. Then click the
tool in the toolbox to allow multiple plot states in the viewport. Then click the ![]() tool or select Plot
tool or select Plot![]() Undeformed Shape to add the undeformed shape plot to the existing deformed plot in the viewport.
Undeformed Shape to add the undeformed shape plot to the existing deformed plot in the viewport.
ABAQUS displays the deformed plot overlaid with the undeformed plot.
To customize the superimposed (i.e., undeformed) plot, select Options![]() Superimpose from the main menu bar.
Superimpose from the main menu bar.
ABAQUS displays the Superimpose Plot Options dialog box.
In the Superimpose Plot Options dialog box, select the Other tab.
In the Other tabbed page, select the Translucency tab. Toggle off Apply Translucency.
Next select the Offset tab. Select Uniform, and enter a value of 0.001 as the offset value.
Click OK to apply the changes and to close the Superimpose Plot Options dialog box.
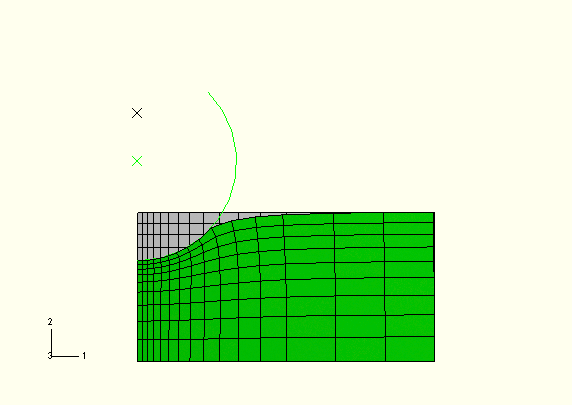
ABAQUS displays the customized deformed plot, as shown in Figure D–4. The undeformed model shape is colored white and is offset slightly from the deformed model shape to prevent the colors from overlapping.