Product: ABAQUS/Explicit
This example problem illustrates the use of surface-based fluid cavities in a multi-chambered automotive airbag inflation analysis using ABAQUS/Explicit. Airbags are supplemental safety devices that minimize the chance of an occupant striking the interior of a vehicle during a crash. The proper deployment of the airbag within a fraction of a second after a collision is detected is crucial to ensure the safety of the occupant. This example describes the modeling and validation of a side curtain airbag impactor test simulation against experimental results.
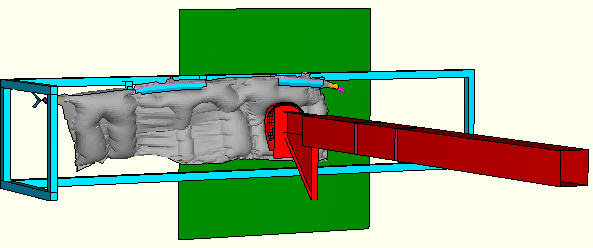
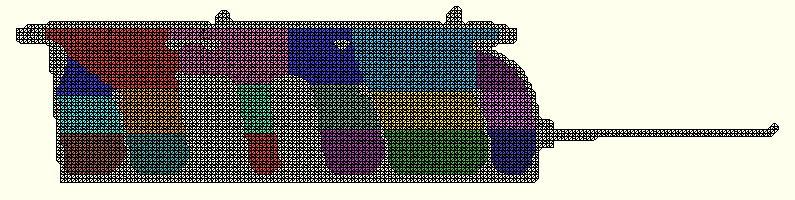
The side curtain airbag model described in this example was provided by Autoliv GmbH. The model setup is shown in Figure 3.3.2–1, which shows an impactor hitting the deployed side curtain airbag. The airbag is divided into 18 chambers to approximate the non-uniform distribution of the gases across the airbag and the gradients in pressure observed during the complex unfolding of the airbag. The temperature and pressure are considered to be uniform in each chamber at any point of time. Each airbag chamber is modeled as a surface-based fluid cavity. The surface-based fluid cavity capability provides a coupling between the pressure exerted by the contained gas on the chamber boundary and the deformation of the gas-filled chamber. The individual chambers are separated by fictitious partitions modeled with surface elements, which represent the area of fluid exchange between the different chambers. The airbag has three inflators located in chambers 1, 6, and 9 that are used to inflate the airbag. The inflators are activated at different times using inflation time amplitude definitions associated with the *FLUID INFLATOR ACTIVATION option. The inflators inject a mixture of 6 gas species, with the molecular fraction, mass flow rate, and temperature of the individual species defined as functions of time. The gas species behave as ideal gases with an adiabatic temperature update. Leakage of the gases to the environment through the airbag fabric is modeled by specifying a discharge coefficient (ratio of the effective leakage area to the total airbag surface area) of 0.0003 for fluid exchange from each airbag chamber. In addition, the loss of heat energy to the environment is also considered by providing the heat energy flow rate as a function of the temperature difference across the airbag fabric.
The external skin of the airbag is represented by 3-node membrane elements (M3D3) and uses a fabric material model available as a built-in user subroutine. The fabric material model is calibrated by specifying the uniaxial behavior of the fibers in the warp and weft directions as well as the shear behavior of the fabric. The behavior of the fibers has been defined such that they offer negligible resistance to compression until a certain compressive strain limit beyond which they begin to offer finite resistance to compression to prevent excessive deformations of the fabric elements. The shear behavior requires the specification of the initial shear modulus, ![]() =9.44 N/mm2, and of the shear locking angle,
=9.44 N/mm2, and of the shear locking angle, ![]() =60°. If the angle between the fibers reduces to the shear locking angle, a higher shear modulus of
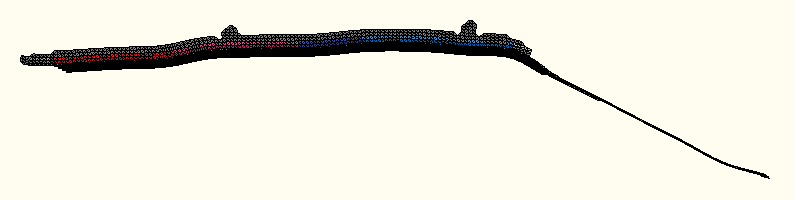
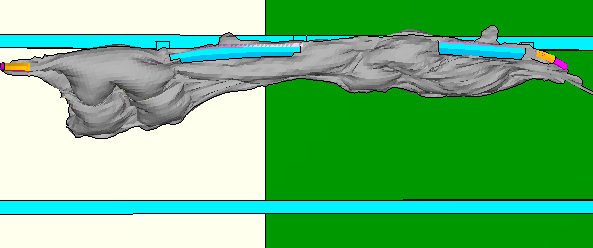
=60°. If the angle between the fibers reduces to the shear locking angle, a higher shear modulus of ![]() =47.2 N/mm2 is used to prevent severe shear deformation. A reference mesh (initial metric) is defined to specify the unfolded stress-free configuration of the airbag. The unstressed reference configuration of the airbag is defined using the *INITIAL CONDITIONS, TYPE=REF COORDINATE option. The initial folded configuration and the reference configuration are used to account for the wrinkles that arise from the airbag folding process. The reference mesh and the folded airbag configuration are shown in Figure 3.3.2–2 and Figure 3.3.2–3, respectively. The general contact algorithm is used to consider self-contact between the airbag fabric layers as well as contact with surrounding structures during the inflation of the airbag.
=47.2 N/mm2 is used to prevent severe shear deformation. A reference mesh (initial metric) is defined to specify the unfolded stress-free configuration of the airbag. The unstressed reference configuration of the airbag is defined using the *INITIAL CONDITIONS, TYPE=REF COORDINATE option. The initial folded configuration and the reference configuration are used to account for the wrinkles that arise from the airbag folding process. The reference mesh and the folded airbag configuration are shown in Figure 3.3.2–2 and Figure 3.3.2–3, respectively. The general contact algorithm is used to consider self-contact between the airbag fabric layers as well as contact with surrounding structures during the inflation of the airbag.
The impactor is modeled as a rigid body with a total mass of 7.2 kg and is given an initial velocity of 4500 mm/s towards the deploying airbag. The mass and velocity of the impactor reflect human head mass and velocities typically observed in vehicle side impacts, respectively.
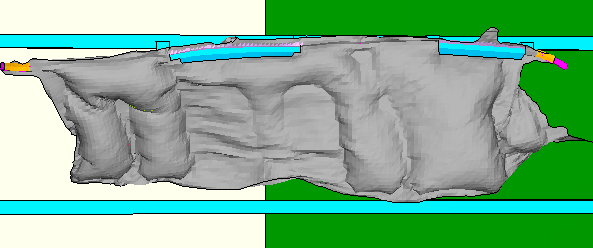
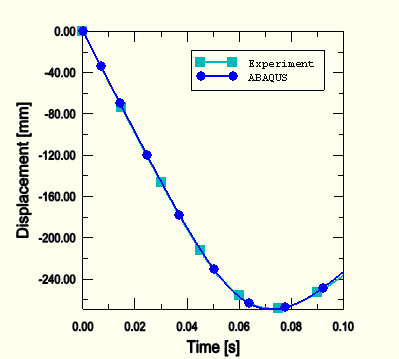
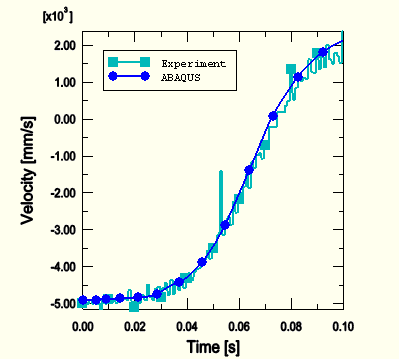
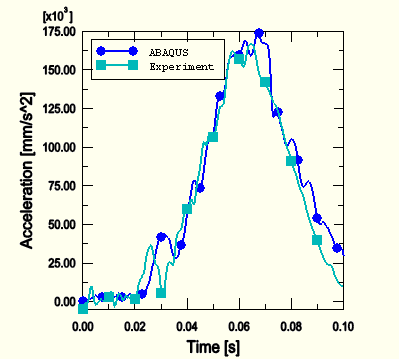
The airbag at different stages of deployment is shown in Figure 3.3.2–4 (8 ms) and Figure 3.3.2–5 (16 ms). Figure 3.3.2–6, Figure 3.3.2–7, and Figure 3.3.2–8 show the time history of displacement, velocity, and acceleration of the impactor as it impacts the airbag, along with comparisons to experimental results. These plots demonstrate the close correlation between ABAQUS/Explicit simulation results and physical test results.
Side curtain airbag impactor test.
Reference mesh for the side curtain airbag.