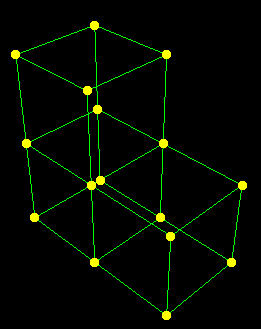
Node symbols (circles, squares, triangles, etc.) identify the location of each node. For example, filled circles are used to symbolize the nodes shown in Figure 37–11.
Node symbols are plot mode-dependent; that is, you control them separately for undeformed, deformed, contour, symbol, and material orientation plots. Toggle Show node symbols to display or suppress node symbols and to choose their color, type, and size.
To customize node symbols:
Locate the node symbol options for the plot mode (undeformed, deformed, contour, symbol, or material orientation) that you want to customize.
From the main menu bar, select Options![]() plot mode; then click the Labels tab in the dialog box that appears.
plot mode; then click the Labels tab in the dialog box that appears.
Toggle Show node symbols to display or suppress node symbols.
When Show node symbols is on, the node symbol color, type, and size options become available.
Choose the color of the node symbols:
Click the color sample ![]() .
.
ABAQUS/CAE displays the Select Color dialog box.
Use one of the methods in the Select Color dialog box to select a new color. For more information, see “Customizing colors,” Section 3.2.9.
Click OK to close the Select Color dialog box.
The color sample changes to the selected color. The new color does not appear in the viewport until you click OK or Apply in the Plot Options dialog box.
Choose the type (circle, square, triangle, etc.) of the node symbols:
Click the Symbol button to reveal the node symbol type options.
Click the symbol type you want.
The specified symbol type appears on the Symbol button.
Choose the size of the node symbols:
Click the Size button to reveal the node symbol size options.
Click Small, Medium, or Large.
The specified symbol size appears on the Size button.
Click Apply to implement your changes.
Since node symbols are plot mode-dependent, the symbols change according to your specification in plots of the current mode only.
Your changes are saved for the duration of the session and will affect all subsequent plots in this mode.