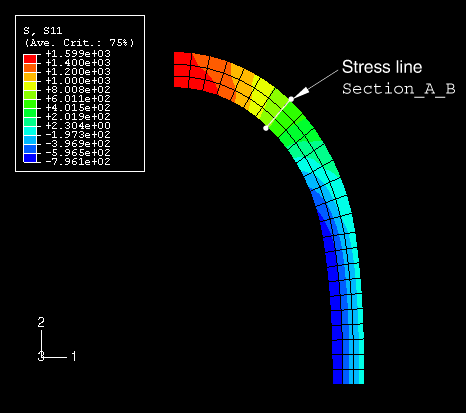
Figure 33–2 shows an example of a stress line defined for an axisymmetric model of a pressure vessel.
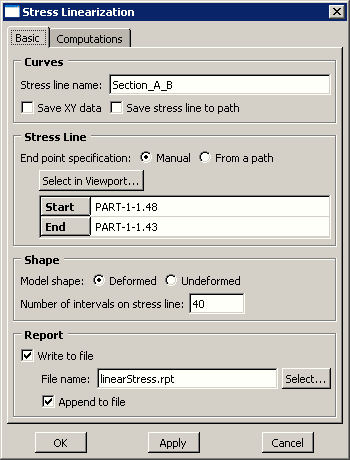
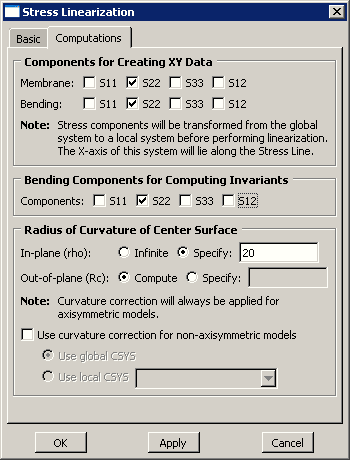
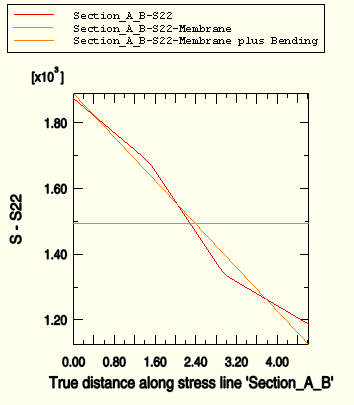
The stress line Section_A_B is defined through the vessel wall. Figure 33–3 and Figure 33–4 show the basic settings and computations, respectively, that you use to linearize the S22 stress component for the undeformed model shape. When you click OK or Apply in the Stress Linearization dialog box, ABAQUS/CAE creates an X–Y plot of the S22 stress component (oriented normal to the stress line) and of the resulting linearized stresses, as shown in Figure 33–5. The following output is also written to a file called linearStress.rpt:********************************************************************************
Statically Equivalent Linear Stress Distribution across a Section,
written on Wed Mar 24 15:05:47 2004
Source
-------
ODB: Job-1.odb
Step: Step-1
Frame: Increment 1: Step Time = 1.000
Linearized Stresses for stress line 'Section_A_B'
X Y Z XY Shear
Stress Stress Stress Stress
Membrane
(Average) Stress -388.19 1493.14 1497.67 74.0502
Membrane plus
Bending, Point 1 -737.581 1889.06 1770.23 74.0502
Membrane plus
Bending, Point 2 -98.2912 1124.3 1245.32 74.0502
-------------------------------- INVARIANT RESULTS --------------------------
Bending components in equation for computing
membrane plus bending stress invariants are: S22
Max. Mid. Min. Tresca Mises
Prin. Prin. Prin. Stress Stress
Membrane
(Average) Stress 1497.67 1496.05 -391.101 1888.77 1887.96
Membrane plus
Bending, Point 1 1891.47 1497.67 -390.596 2282.06 2112.87
Membrane plus
Bending, Point 2 1497.67 1127.92 -391.807 1889.47 1734.41The Y Stress corresponds to the S22 stress shown in Figure 33–5. The actual stress values plotted in the curve Section_A_B_S22 do not appear in the report. The linearized membrane and membrane-plus-bending stress curves are generated from the values shown for Y Stress. The reported invariants are calculated from the selected linearized components.