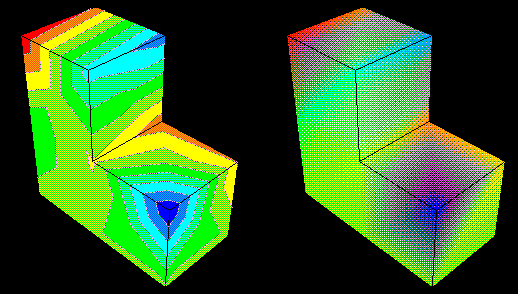
ABAQUS/CAE evenly divides the range between the minimum and maximum contour values into intervals. You can customize the number of intervals and whether the intervals are represented by discrete or continuous colors. By default, there are 12 discretely colored intervals. Figure 27–7 shows a banded-type contour plot with nine uniform contour intervals on the left and with continuous contours on the right.
The contour legend, if active, will include two more intervals than the number you choose. ABAQUS/CAE adds intervals at the top and bottom of the legend to indicate any values that exceed the contour plot limits. For more information on the contour legend, see “Customizing the legend,” Section 38.1.
To customize the contour intervals:
Locate the Contour Intervals options.
From the main menu bar, select Options![]() Contour; then click the Basic tab in the dialog box that appears. The Contour Intervals options are on the left side of the page.
Contour; then click the Basic tab in the dialog box that appears. The Contour Intervals options are on the left side of the page.
Choose Continuous or Uniform to request continuous or discrete contour intervals, respectively.
Continuous intervals are available only for banded-type contours. ABAQUS represents your contour values in a smooth, non-delineated color spectrum.
When you choose Uniform intervals, the Contour Interval slider becomes available.
For Uniform intervals, choose the number of intervals.
Drag the Contour Intervals slider to the number of intervals (between 2 and 24) that you want.
Click Apply to implement your changes.
The contours and, if active, the contour legend in the current viewport change to reflect the interval options you have selected.
Your changes are saved for the duration of the session and will affect all subsequent plots in this mode.