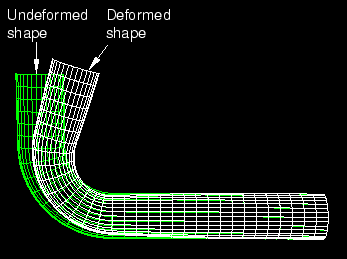
You can combine the deformed and undeformed model shapes in a single plot. Combining the shapes provides a context for displaying and interpreting the deformations. An example of superimposed model shapes is shown in Figure 26–1.
To superimpose the deformed and undeformed shapes:
Produce a deformed plot.
From the main menu bar, select Plot![]() Deformed Shape.
Deformed Shape.
Locate the Superimpose undeformed plot option.
From the main menu bar, select Options![]() Deformed. Click the Basic tab in the dialog box that appears.
Deformed. Click the Basic tab in the dialog box that appears.
The Superimpose undeformed plot option is in the upper left corner of the Basic page.
Toggle Superimpose undeformed plot to request or suppress the display of the undeformed shape in addition to the deformed shape.
Note: When Superimpose undeformed plot is on, the position of the deformed shape relative to the undeformed shape is controlled by the deformed plot Offset options.
Customize the offset of the deformed shape from the undeformed shape.
Locate the deformed shape Offset options.
From the main menu bar, select Options![]() Deformed. Click the Other tab from the dialog box that appears. Then, click the Offset tab.
Deformed. Click the Other tab from the dialog box that appears. Then, click the Offset tab.
The Offset options appear.
Click to select one of the following options:
No offset to suppress any shifting of the deformed shape's position.
Uniform to shift the position of the deformed shape equally in each of the X-, Y-, and Z-directions.
When Uniform is on, a single offset value becomes available. In the Value field, enter a single offset value to add uniformly to nodal X-, Y-, and Z-coordinates.
Nonuniform to shift the position of the deformed shape unequally in the X-, Y-, and Z-directions.
When Nonuniform is on, individual X-, Y-, and Z-direction offset values become available. Click on each of the X, Y, and Z value boxes to enter offset values to add to the nodal X-, Y-, and Z-coordinates, respectively.
Click Apply to implement your changes.
The deformed shape appears at the specified offset from the undeformed shape in the current viewport. To customize the deformed shape, use the Deformed Shape Plot Options dialog box; to customize the undeformed shape, use the Undeformed Shape Plot Options dialog box.
Your changes are saved for the duration of the session and will affect all subsequent plots in this mode.