X–Y data can be generated for a specific path through your model. In this tutorial you will specify a node list path along the top of the foam block and plot the displacement magnitude along this path.
A path is a line you define by specifying a series of points through the model. In a node list path all of the specified points are nodal locations. You create a node list path by entering node labels or node label ranges in a table. To determine the node labels of interest, it is helpful to create a model plot with the node labels visible.
To create a node list path:
Click the ![]() tool to display a contour plot of the model.
tool to display a contour plot of the model.
Use the Contour Options to display the node labels.
From the main menu bar, select Tools![]() Path
Path![]() Create.
Create.
The Create Path dialog box appears.
Name the path Displacement. Accept the default selection of Node list as the path type, and click Continue.
The Edit Node List Path dialog box appears.
In the Path Definition table, type PART-1-1 in the Part Instance field and 1:601:40 in the Node Labels field and press [Enter]. (This input specifies a range of nodes from 1 to 601 at increments of 40.) Alternatively, you can pick the nodes for the node list directly from the viewport by clicking Add Before...or Add After... in the Edit Node List Path dialog box.
The selected path is highlighted in the plot in the current viewport.
Click OK to create the path and to close the Edit Node List Path dialog box.
ABAQUS obtains analysis results for each of the points on the path you have defined and generates X–Y data pairs; the X-values are the specified points in the model, and the Y-values are the analysis results at these points. You can generate an X–Y plot of the data pairs.
To display displacement results along a node list path:
From the main menu bar, select Tools![]() XY Data
XY Data![]() Create.
Create.
In the Create XY Data dialog box that appears, select Path; and click Continue.
The XY Data from Path dialog box appears with the path that you created visible in the list of available paths.
Accept the default selections in the X Values portion of the dialog box.
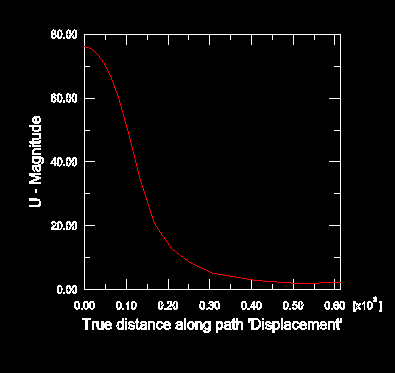
The result that will be plotted is displayed in the Y Values portion of the dialog box. In this case U is the field output variable that was selected last (when you generated the symbol plot).
Click Plot to generate an X–Y plot of U along the path, as shown in Figure D–17.
You have now finished the tutorial.