You can display a contour plot of your model showing a variable such as stress, strain, or temperature. In all plot modes, including contour, ABAQUS selects a default variable to display. The default variable selected depends on the variables available in the output database, which in turn depend on the analysis procedures and the requested output. You can choose to display any variable that is available in the field output portion of the output database. If you select a variable when you are not in a plot mode that can display that variable, a dialog box appears prompting you to switch to a valid plot mode.
You can use the plot options to customize the appearance of a contour plot. ABAQUS applies your customized settings to every contour plot displayed in the current viewport. If you display a contour plot in a new viewport, ABAQUS reverts to the default plot options.
You will first display a contour plot of the default variable.
To display a contour plot:
From the main menu bar, select Plot![]() Contours.
Contours.
Tip:
You can also display a contour plot using the ![]() tool in the Visualization module toolbox.
tool in the Visualization module toolbox.
The state block indicates that the variable plotted is S, MISES, the default variable chosen by ABAQUS. ABAQUS displays the results at the same step and frame that you used to display the deformed shape plot.
Use a combination of the buttons in the prompt area and the Step/Frame dialog box to view the contour plot in different frames and in different steps.
Note: The legend changes as you move between frames. ABAQUS updates the maximum and minimum values and computes the contour intervals in every frame.
ABAQUS selects a default variable to display in a contour plot, but you can display any variable that is available in the field output portion of the output database.
To select the variable to plot:
From the main menu bar, select Result![]() Field Output.
Field Output.
ABAQUS displays the Field Output dialog box. In all plot modes you use the Field Output dialog box to select the variable to display.
To see the complete description of the variable choices, increase the width of the Field Output dialog box by dragging the right or left edge.
Click the Primary Variable tab if it is not already selected.
To select the 22-component of strain as the primary variable, do the following:
From the Output Variable field, select LE (logarithmic strain components at integration points).
From the Component field, select the component LE22.
Click OK to select LE22 as the primary variable and to close the Field Output dialog box.
The contour plot in the current viewport changes to a plot of LE22, as shown in Figure D–7.
By default, ABAQUS displays a contour plot using 12 equal intervals between the maximum and minimum value of the selected variable. ABAQUS updates the maximum and minimum values and computes new contour intervals for every frame. The legend indicates the calculated intervals and the color corresponding to each interval. You can change the number of intervals, and you can set the values corresponding to the maximum and minimum contour limits. When you set the contour limits, ABAQUS uses the values you supply in every contour plot displayed thereafter, regardless of the frame and which variable is being contoured.
To customize a contour plot:
Display the contour plot at the end of the last increment of the second step (Step 2 and Step Time = 1.000).
From the main menu bar, select Options![]() Contour.
Contour.
ABAQUS displays the Contour Plot Options dialog box.
Click the Basic tab if it is not already selected, and drag the uniform contour intervals slider to 16.
Click the Limits tab to access the contour limits options.
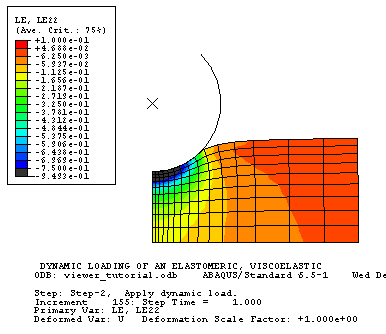
In the Max field, toggle the Specify button and type a maximum contour limit of 0.1.
In the Min field, toggle the Specify button and type a minimum of –0.75.
Click Apply to view the customized contour plot.
The plot changes, as shown in Figure D–8.
Although you selected 16 contour intervals, the plot legend displays 17 intervals. ABAQUS adds intervals to indicate any values that are greater than the maximum contour limit or less than the minimum contour limit and displays these values in light gray and dark gray, respectively. In this example, areas undergoing compressive strains greater than 0.75 are shown in dark gray. The minimum strain in the model is shown at the bottom of the contour legend. You might use either of these colors to indicate elements that fall outside the design range for the selected variable.
Under the Limits tab, examine the Min and Max Auto-compute options.
The minimum and maximum values of strain for the contour plot are shown next to the two Auto-compute options.
Click OK to close the Contour Plot Options dialog box.