You will now display the undeformed shape plot and use the plot options to request element numbering.
An undeformed plot for a general analysis step displays the initial shape of your model.
To display an undeformed shape plot:
From the main menu bar, select Plot![]() Undeformed Shape.
Undeformed Shape.
Tip:
You can select a plot mode from the main menu bar or from the Visualization module toolbox. Click the undeformed plot tool ![]() in the Visualization module toolbox to select the undeformed mode.
in the Visualization module toolbox to select the undeformed mode.
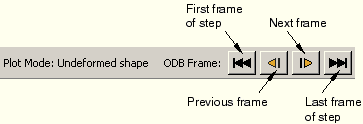
The Visualization module enters the undeformed plot mode and displays the undeformed model at the end of the analysis—Step 3 and Step Time = 10.00 in this example. The plot mode and a set of buttons also appear in the prompt area, as shown in Figure D–3.
In the elastomeric foam block example ABAQUS/Standard wrote the data to the field output portion of the output database after every 10 increments and after the last increment of a step. Each increment written to the output database is called a frame.In this example the undeformed model does not change between frames, but in some simulations the model changes during the analysis; for example, if rigid surfaces are introduced.
Use the pan tool, which is one of several view manipulation tools available on the toolbar, to move the model above the state and title blocks as follows.
From the toolbar, click the pan tool ![]() to enter pan mode.
to enter pan mode.
The cursor changes to a four-headed arrow: 
To move the model away from the state and title blocks, click in the viewport and drag the cursor upward.
The model moves along the same path as the cursor.
Click mouse button 2 to exit pan mode.
From the prompt area, click the button on the far left to move to the first frame of the current step.
ABAQUS displays the undeformed model at the beginning of the third step—Step 3, Increment 0, and Step Time = 0.0000E+00. This is the state of the model at the beginning of the step.
The first frame and last frame buttons take you directly to the first or last frame of the current step but do not allow you to move between steps. The next frame and previous frame buttons in the prompt area allow you to move between each frame of the analysis and can cross step boundaries as needed.
Click the previous frame button.
ABAQUS displays the undeformed model at the end of the second step—Step 2 and Step Time = 1.000.
When you are at the first frame of the current step, clicking the previous frame button takes you to the last frame of the previous step. Conversely, when you are at the last frame of the current step, clicking the next frame button takes you to the first frame of the next step.
Each plot mode—undeformed, deformed, contour, etc.—provides a set of options that allow you to customize the appearance of the type of plot associated with that mode. Regardless of the plot mode, customization options apply only to the current viewport and are not saved between sessions. Use the undeformed plot options to customize the appearance of all undeformed plots.
To customize an undeformed shape plot:
From the main menu bar, select Options![]() Undeformed Shape.
Undeformed Shape.
Tip: The Visualization module provides the following three methods to access the customization options for the current plot while you are in any of the plot modes:
Select Options![]() Plot Mode from the main menu bar.
Plot Mode from the main menu bar.
Click the Plot Mode Options button at the far right of the prompt area.
Click mouse button 3 in the viewport, and select Plot Mode Options from the menu that appears.
ABAQUS displays the Undeformed Shape Plot Options dialog box.
Click the Basic tab in the Undeformed Shape Plot Options dialog box if it is not already selected. Choose the Filled render style, and click Apply.
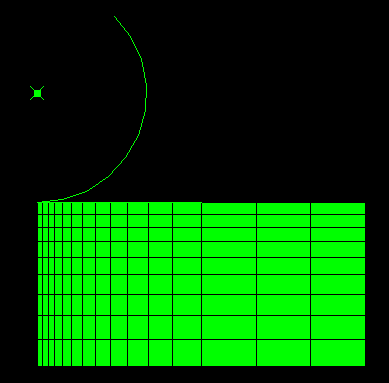
ABAQUS displays a filled view of the model. Because the model is a two-dimensional model, it displays all edges—the perimeter edges and the edges of each element—as shown in Figure D–4.
For clarity, most of the figures in this tutorial do not include the title block, state block, and orientation triad. In general, the figures illustrate the effect on the model of changing the plot mode and customizing the plot. You can toggle off and customize the title block, state block, and orientation triad by selecting Viewport![]() Viewport Annotation Options from the main menu bar.
Viewport Annotation Options from the main menu bar.
By default, ABAQUS fills the model in green and displays element labels using cyan text. You will change the color of the element labels from cyan to red and display them. From the Undeformed Shape Plot Options dialog box, click the Labels tab and do the following:
Toggle on Show element labels.
Click Apply.
ABAQUS displays the element numbering using cyan text.
Click the color sample ![]() for the element labels.
for the element labels.
ABAQUS/CAE displays the Select Color dialog box.
Click the RGB tab and set the red, green, and blue values to 255, 0, and 0, respectively.
Tip: You can also select red from the colors near the bottom of the dialog box or use any of the other available selection methods.
Click OK to accept your selection.
ABAQUS/CAE closes the Select Color dialog box and updates the color sample to red.
Click OK.
The color of the element labels changes from cyan to red, and the Undeformed Plot Options dialog box closes.