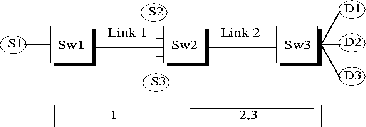
 |
Bobby Vandalore, Sonia Fahmy, Raj Jain, Rohit Goyal, Mukul Goyal
The Ohio State University
Department of Computer and Information Science
Columbus, OH 43210-1277
Phone: 614-688-4482, Fax: 614-292-2911
E-mail: {
vandalor, fahmy, jain, goyal, mukul}@cse.wustl.edu
An explicit rate switch scheme monitors the load at each link and gives feedback to the sources. We define the overload factor as the ratio of the input rate to the available capacity. In this paper, we present three overload based switch schemes which provide MCR (minimum cell rate) guarantees for the ATM (asynchronous transfer mode) ABR (available bit rate) service. The switch schemes proposed use the overload factor and other terms including current source rate and target utilization to calculate feedback rates. A dynamic queue control mechanism is used to achieve efficient usage of the link, control queues and, achieve constant queuing delay at steady state. The proposed algorithms are studied and compared using several configurations. The configurations were chosen to test the performance of the algorithms in presence of link bottlenecks, source bottlenecks and transient sources. Finally, a comparison of the proposed algorithms based on the simulation results is given.
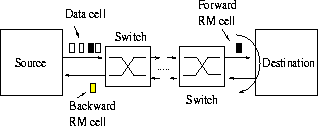
The ATM (asynchronous transfer mode) is the chosen technology for implementing B-ISDN (broad-band integrated services digital network). ATM is a connection-oriented cell switching standard. It uses fixed size cells which are 53 bytes long. ATM offers different service categories for transporting different types of traffic. The ABR (available bit rate) service category in ATM is used to transport data traffic with minimum rate guarantee. The ABR users specify minimum rate using MCR parameter during connection setup. The ABR service gives guarantee that the ACR (allowed cell rate) is never less than MCR. ABR uses closed loop feedback to control the source rates (see Figure 1). The source sends periodically (after every Nrm-1 data cells) an RM (resource management) cell to gather information from the network [ 1]. The RM cells are turned around at the destination. The switches along the path indicate the current rate which they can support in the explicit rate (ER) field of the RM cell. When the source receives the backward RM cells, it adjusts its allowed rate accordingly.
|
|
The specification of the ABR feedback control algorithm (switch scheme) is not yet standardized. An early switch algorithm used binary feedback to advise source about congestion information [ 2]. Distributed algorithms for the congestion control using explicit rate feedback were given in [ 3, 4]. Improved, simpler distributed algorithms were proposed in [ 5, 6, 7, 8, 9, 10]. Recently, a generalized definition of max-min fairness and its distributed implementation were presented in [ 11, 12]. A discussion of weight-based max-min fairness policy and its implementation in ABR service is given [ 13]. The fairness criteria in the presence of MCR guarantees is discussed [ 14, 15].
In a related work, we have proposed a general definition of fairness, and gave an overload based ABR switch scheme which provides MCR guarantees [ 16]. In this paper, we propose three additional algorithms which use the overload factor to calculate the explicit rate feedback. All the proposed algorithms provide MCR guarantee and achieve generalized fairness.
The load factor (also referred to as ``overload factor'' or ``overload'') is the ratio of the measured input rate to the available ABR (available bit rate) capacity. ERICA+ switch scheme monitors the load on the link and calculates feedback based on the load. It tries to achieve unit load on links to efficiently use the link and also converge to max-min fairness [ 1]. Max-min fairness assumes zero MCR values. In this paper, we have used the generalized fairness with MCR as defined in [ 16].
Section IIdiscusses the definition of generalized fairness used in algorithms. Section IIIgives a brief overview of ERICA+ and then discusses proposed algorithms. In section IV, various configurations used in the simulations are discussed. In section Vwe present the results of the simulations. The simulations test whether the schemes provide MCR guarantees and converge to generalized fairness. A comparison of the algorithms based on the simulations results is given in section VI. Finally, section VIIgives the conclusions of the paper.
ATM Forum Traffic Management Specification 4.0 [ 1] recommends different definitions of fairness to be used when MCRs are non-zero. These fairness definitions are equal share of excess bandwidth, proportional to MCR of excess bandwidth, proportional to predetermined weights of bandwidth. Here, we give the definition (as defined [ 16]) of generalized weighted fairness which can realize all the above fairness definitions.
Define the following parameters:
The general weighted (GW) fair allocation is defined as follows:
The excess available bandwidth
![]() is divided in proportion to the predetermined weights.
is divided in proportion to the predetermined weights.
The general structure of the algorithms proposed are similar to the ERICA+ [ 5]. First, we briefly discuss the ERICA+ algorithm and then give the general structure of the proposed algorithms. The three switch algorithms proposed have the same structure and only differ in, the way in which end of interval accounting is done, and the manner in which the feedback explicit rate is calculated. The switch algorithm with MCR guarantees discussed in [ 16] also has the same structure as three these algorithms.
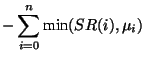
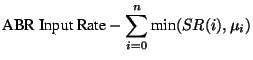
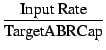
ERICA+ operates at the output port of a switch. It periodically monitors the load, active number of VCs and provides feedback in the BRM (backward RM) cells. The measurement period is called the ``averaging interval.'' The measurements are done in forward direction and feedback is given in the reverse direction. The complete description of ERICA+ algorithm can be obtained from [ 5]. In overload conditions, the algorithm calculates the maximum of the FairShare(link capacity divided by number of VCs) and VCShare(current cell rate divided by overload) as the feedback rate. In underload conditions, the maximum of MaxAllocPrev(which is the maximum allocation given in the previous averaging interval) and the previous two terms is the feedback rate. Part of the available ABR capacity is used for draining queues. Target ABR capacity is obtained by multiplying the total available ABR capacity by a Fractionterm. 1 - Fractionamount of the link capacity is used to drain the queues. Fractioncan be either a constant less than one (e.g., Fraction= 0.9 implies 90% link utilization), or dynamic function of switch queue length. ERICA+ uses a two hyperbolic curves with which control the queue in underload and overload regions. To ensure that a minimum amount of link capacity is used for data, the Fractionvalue is limited to a minimum of QDLF(queue drain limit factor). Typically a value QDLF= 0.5 is used. The dynamic queue control function given above can be expressed as follows
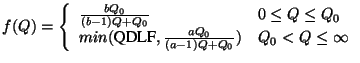
The ``Target Delay'' parameter specifies the desired queue length (Q
0
) at steady state. The 'a-curve' (hyperbola given by
![]() ) is used as long as it evaluates to value greater than QDLF. The design of queue control functions which enable the switch algorithms to reduce rate oscillations, achieve constant delay and high link utilization (100%) is discussed in detail in [
17].
) is used as long as it evaluates to value greater than QDLF. The design of queue control functions which enable the switch algorithms to reduce rate oscillations, achieve constant delay and high link utilization (100%) is discussed in detail in [
17].
The three different switch schemes have the following common algorithmic structure. They differ in the manner in which the feedback rate is calculated and in accounting. The algorithms perform the following steps for calculating the feedback rate:
The sources transmit data initially at their initial cell rate (ICR) value. After one round trip time, the feedback from the switches arrives at the sources, and sources adjust their allowed rate accordingly. When a constant queue control function is used (say Fraction= 0.9) rates converge to the GW fairness allocation. When a dynamic queue control function is used, the available capacity varies depending on the queue length. Therefore, the feedback rate also varies till the queues are drained. Once the queues are drained, the feedback rates converge to the GW fair allocation. We present simulation results using both the constant queue and dynamic queue control functions.
Overload Based Algorithm Structure:
At the End of Each Averaging Interval:
|
|
|
|
|
| | |
 |
|
|
|
|
|
|
|
|
|
 |
|
| z |
|
 |
|
When an FRM is received:
|
|
|
|
|
When a BRM is received:
|
|
|
|
|
|
|
|
|
|
|
|
|
|
|
The key steps that differentiate the algorithms are the procedures End_of_Interval_Accounting()and Calculate_Excess_ER().
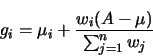
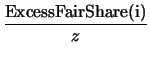
The
ExcessFairShareterm is defined as follows:
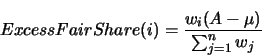
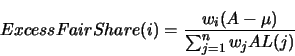
This divides the excess available bandwidth (
![]() ) (i.e., ABR capacity) in proportion to the weights w(i). An allocation of
) (i.e., ABR capacity) in proportion to the weights w(i). An allocation of
![]() for each source iis the GW fair allocation. A source might be bottlenecked at some other link, hence using less than its fair share of link capacity. By using the notion of activity level, the effective weight of the bottlenecked source can be calculated.
for each source iis the GW fair allocation. A source might be bottlenecked at some other link, hence using less than its fair share of link capacity. By using the notion of activity level, the effective weight of the bottlenecked source can be calculated.
The activity level for a given VC is defined as follows:
The activity level can be used to accurately estimate the effective number of VCs. Effective number of VCs is given by the following expression:
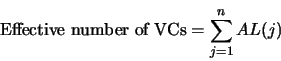
The VCs which are bottlenecked by this link will have activity level of 1 and will be counted as one VC. The VCs bottlenecked elsewhere will are counted as fractional VCs depending on their activity level. The proof that above expression estimates accurately the effective number of VCs is given in [ 18].
We extend the notion activity level to the weighted case by multiplying the weight function with the activity level of the ExcessFairShareterm. Therefore the ExcessFairShareis:
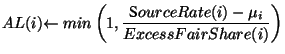
In this algorithm, the Ex_ERis calculated based on ExcessFairShareand the overload factor z. For each source, the activity level and the ExcessFairShareare updated at the end of each interval. When a BRM cell arrives, the feedback rate is calculated as the ExcessFairShareterm, divided by the overload. The source rate (VCShareterm) is not used in feedback rate calculation.
If the network is overloaded (z> 1) the Ex_ER decreases since fairshare is divided by the overload factor z. In underload conditions (z< 1) the sources are asked to increase their rate. Due the recursive definition of ExcessFairShareand activity levels these value converge.
As the network reaches steady state, the overload will become one and the Ex_ERwill converge to the required ExcessFairShare, achieving GW fair allocation. Proof convergence is similar to the proof given in [ 16]. Since the overload factor varies every averaging interval, the rate oscillations increase for this algorithm. If the ``averaging interval'' is greater than the feedback loop, then the switch adjusts to the feedback rate before the next averaging interval. If the averaging interval is smaller, then before the source can adjust to the feedback rate, multiple feedbacks are given. In this situation ExcessFairSharecalculation is not accurate, since the source rate does not reflect the feedback rate. Exponential averaging of the ExcessFairShareterm is used to overcome this problem. Exponential averaging is done as follows:
![]()
where the
PrevExcessFairShareis the value calculated for the previous averaging interval. The parameter
![]() is called the decay factor. In the simulations a value of
is called the decay factor. In the simulations a value of
![]() was used.
was used.
End_of_Interval_Accounting():
foreach VC i do
 |
| | |
 |
| | |
Calculate_Excess_ER():
|
|
|
 |
|
Let the GW fair allocation be
![]() for nbottle-necked sources. The excess bandwidth is divided proportional to weights
for nbottle-necked sources. The excess bandwidth is divided proportional to weights
![]() . Let mbe the VC such that term
. Let mbe the VC such that term
![]() is the maximum of such terms of all VCs. An allocation which assigns rates as
is the maximum of such terms of all VCs. An allocation which assigns rates as
![]() will achieve GW fairness. The term
will achieve GW fairness. The term
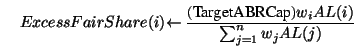
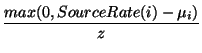
![]() is defined as the weighted maximum allocation. In algorithm B, the feedback is calculated as term proportional to weight of VC and the weighted maximum allocation is divided by overload. The overload in the denominator increases or decreases the allocation depending on the load. The source rate is not used in the feedback calculation. This algorithm can give rise to large queues if the weighted maximum allocation is measured incorrectly. This problem of large queues occurred during the simulation of this algorithm using GFC-2 configuration.
is defined as the weighted maximum allocation. In algorithm B, the feedback is calculated as term proportional to weight of VC and the weighted maximum allocation is divided by overload. The overload in the denominator increases or decreases the allocation depending on the load. The source rate is not used in the feedback calculation. This algorithm can give rise to large queues if the weighted maximum allocation is measured incorrectly. This problem of large queues occurred during the simulation of this algorithm using GFC-2 configuration.
End_of_Interval_Accounting():
|
|
|
|
|
|
|
|
0 | |
Calculate_Excess_ER():
|
|
|
 |
|
|
|
|
|
|
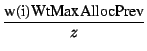
In this algorithm, the
End_of_Interval_Accounting()is the same as in the previous algorithm (algorithm B). The
Ex_ERis calculated based on the weighted maximum previous allocation (
WtMaxAllocPrev) and VCShareunder underloaded conditions (
![]() ). For overloaded conditions, the VCShareis given as the feedback rate. The problem of large queues explained in the previous algorithm is not expected to occur since the maximum previous allocation is given as feedback only if the link underloaded. As the overload converges to one, the VCShareconverges to
). For overloaded conditions, the VCShareis given as the feedback rate. The problem of large queues explained in the previous algorithm is not expected to occur since the maximum previous allocation is given as feedback only if the link underloaded. As the overload converges to one, the VCShareconverges to
![]() , achieving the GW fair allocation.
, achieving the GW fair allocation.
Calculate_Excess_ER():
|
|
|
 |
|
|
|
| | |
|
|
|
|
|
|
|
|
|
|
|
|
|
|
|
We used simple, link bottleneck and source bottleneck configurations to test the proposed algorithms. Infinite sources were used (which have an infinite amount of data to send, and always send data at ACR) in all the simulations. The rates are expected to converge to GW fair allocation values in the presence of infinite sources. The algorithms are expected to give minimum rate guarantees for Poisson or self-similar sources. These types of sources were not used since the GW fair allocation for source with varying rates is also dynamically varying. The data traffic is only one way, from source to destination. Using two-way traffic would produce similar results, expect that the convergence time would be larger since the RM cells in the backward direction would travel with traffic from destination to source. All the link bandwidths are 149.76 (155.52 less the SONET overhead), except in the GFC-2 configuration.
Exponential averaging was used to decrease the variation in measured quantities such as overload and number of VCs. Exponential averaging of overload factor and number of VCs were done with a decay factor of 0.8 for algorithm C. The algorithms A and B are more sensitive to overload factor. So, a the decay factor of 0.4 was used to average overload in algorithms A and B.
| Configuration | Link | Averaging | Target | Wt |
| Name | Dist | interval | Delay | Func |
| Three Sources | 1000 Km | 5 ms | 1.5 ms | 1 |
| Src Bottleneck | 1000 Km | 5 ms | 1.5 ms | 1 |
| GFC-2 | 1000 Km | 15 ms | 1.5 ms | 1 |
The weight function of one was used in all configurations. This corresponds to MCR plus equal share of excess bandwidth. The value of
![]() was used for algorithm C. In [
16] it was shown that an overload based explicit rate algorithm achieves GW fairness for various weight functions.
was used for algorithm C. In [
16] it was shown that an overload based explicit rate algorithm achieves GW fairness for various weight functions.
In this section we present the simulation results of algorithms using different configurations. Table 2gives the expected GW fair allocation with constant queue control function (shown as configuration name and CQF) and with dynamic queue control function (shown as configuration and DQF) for each simulation using three source configuration. The queues when using constant queue control function took longer time to drain. The bottleneck link utilization was as expected 90% when constant queue control was used. With dynamic queue control the algorithms achieved 100% link utilization for bottlenecked links.
| Config. and Queue Control | Src 1 | Src 2 | Src 3 | | | |
| Simple and CQF | 24.93 | 44.93 | 64.93 | | | |
| Simple and DQF | 29.92 | 49.92 | 69.92 | | | |
| Src Bottleneck + CQF (0-0.4s) | 32.39 | 52.39 | 72.39 | | | |
| Src Bottleneck + DQF (0-0.4s) | 39.86 | 59.86 | 79.86 | | | |
| Src Bottleneck + CQF (0.4-0.8s) | 24.93 | 44.93 | 64.93 | | | |
| Src Bottleneck + DQF (0.4-0.8s) | 29.92 | 49.92 | 69.92 | | | |
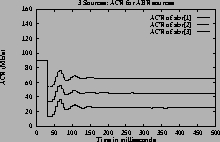
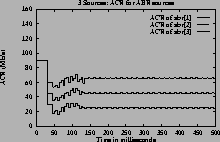
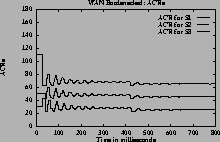
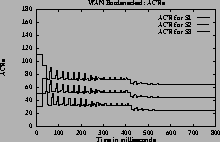
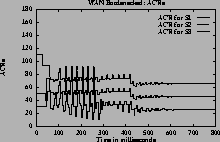
In this configuration the MCR values of (10,30,50) Mbps were used. The total simulation time was 800 ms. The source S1, is bottle-necked at 10 Mbps for first 400 ms of the simulation. It always sends data up to 10 Mbps even its ACR larger than 10 Mbps. Figures 6 (a)-(c) shows the ACRs for the algorithms A, B, and C with constant queue control respectively. The expected allocation is (32.39,52.39,72.39) for first 400 ms and it is (29.92,49.92,69.92) between 400 ms and 800 ms. The algorithms do converge to the expected allocation. The algorithm A has lesser rate oscillations and converges faster than algorithm B and C.
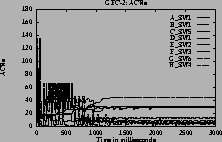
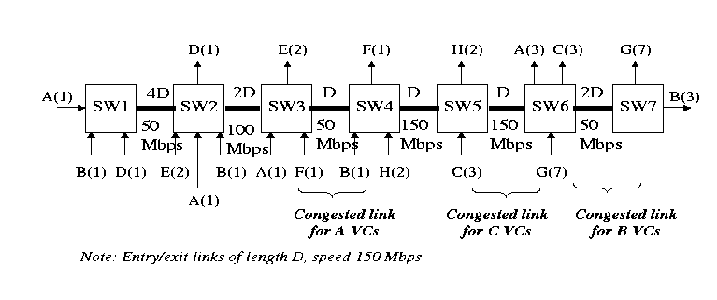
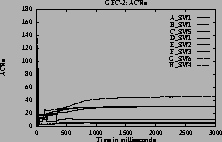
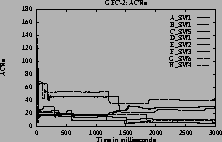
MCR value of zero was used for all sources expect for type A sources which had a value MCR of 5 Mbps. The expected allocation for each type of VC using constant queue control and dynamic queue control is given in the table 3. Figure 7 (a)-(c) show the ACRs of each type of VCs A through H for algorithms A, B, and C with constant queue control respectively. Algorithm A converges to the expected allocation. Algorithm B with constant queue control, does not converge to expected GW fair allocation within the simulation time as seen in figure 7 (f). This is due the presence of sources with different round trip times sharing the same bottleneck link. In such a case the sources with larger round trip time take a long time to adjust the rates compared to the ones which have smaller round trip times. For example maximum allocation for A type VC which has large round trip time was assigned for seven VCs of type G which have small round trip time. This also led to large switch queues and slow convergence of algorithm B. The input rate at the link between SW6 and SW7 is overloaded by a factor of seven which gives rise to the huge queues.
| A | B | C | D | E | F | G | H | |
| 11.25 | 5 | 33.75 | 33.75 | 33.75 | 6.25 | 5 | 50.62 | |
| 9 | 4.5 | 31.5 | 31.5 | 31.5 | 9 | 4.5 | 47.25 | |
| Algo- | End of Intrvl | Feedback | Max | Sensitivity |
| rithm | Complexity | Complexity | Q Len | to Q cntrl |
| A | O(N) | O(1) | Med | High |
| B | O(1) | O(1) | Large | Low |
| C | O(1) | O(1) | Med | Low |
Algorithm A has higher complexity than the other two algorithms. Algorithm B results in large switch queues since in presence of multiple round trip time. The algorithm C is the best of the proposed algorithm since it has O(1) complexity both at the end of interval and when a BRM cell arrives. Also, algorithm C has smaller queues compared to algorithm B.
In this paper, we have presented three algorithms which achieve GW fairness and provide MCR guarantee. The algorithms monitor the load on the link and calculate the overload factor. The overload and other quantities ( ExcessFairShareor WtMaxAllocPrev) are used to calculate the feedback rates.
The algorithms proposed have similar structure. The algorithms differ in the end of interval accounting and feedback calculation. Simulations show that the algorithms converge to GW fairness in most cases. Queue control can be done using constant function and dynamic (hyperbolic) function. Algorithm A has O(N) complexity for the end of interval calculations. Algorithm B, can give rise to large queues if the configuration has sources with different round trip times sharing the same link. The algorithm C, which uses the VCShareand WtMaxAllocPrevis the best, since it has O(1) complexity and is less sensitive to queue control function.
|
|
|
 jain/
jain/ 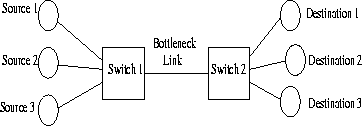
 [Algorithm B and DQF]
 [Algorithm C and DQF]
 [Algorithm B with CQF]
 [Algorithm B and CQF]
 [Algorithm C and CQF]