Measurement of ATM Frame Latency
Abstract
This paper addresses the problem of measuring frame latency in ATM switches. The frames consisting of several ATM cells may arrive with numerous gaps between cells. It is important that the gaps present in the input stream be not counted towards the switch's contribution to the frame delay. The proposed solution called "MIMO" (Message-In Message-Out) latency improves upon other latency metrics commonly used for continuous frame technologies such as frame relay. MIMO latency is defined as the difference between LILO latency through the switch and that through an ideal switch. The definition and the discussion also apply to any network of switches as well. We show that the formulation of MIMO aggregation is very useful in understanding the contribution of each network element and their interconnections in the total frame latency.
Keywords: Frame latency metrics, Performance evaluation, QoS parameters, ATM switch performance.
1. Introduction
Frame latency is of particular interest as a QoS parameter, because the frame level is more likely to influence the application latency and performance. The performance of ATM equipment and the quality of services have been defined in terms of cell-level metrics such as cell transfer delay (CTD), cell delay variation (CDV) and cell loss ratio (CLR). However, cell-level metrics do not very often reflect the performance as experienced (or desired) by end users. For example, a video user sending 30 frames/sec would like frames to be completely delivered every 33 msec and it does not matter whether the cells belonging to a frame arrive back-to-back or regularly spaced. Thus, it is the frame delay and its variation that matters, not cell delay.
This paper discusses delays that ATM switches introduce to frames, and the performance metrics to measure them. A frame is defined here as the ATM Adaptation Layer (AAL) protocol data unit (PDU). One problem in measuring the frame delay in ATM network is that when seen inside the network, the frames may be discontinuous with numerous gaps between the cells as well as cells of other frames. Note that the monitoring equipment, if placed inside the host, will be affected by the performance of the host and may not accurately reflect the performance of the switch. Thus, the test probes of the monitoring equipment should be placed at the entrance and the exit of the system to be measured [1].
The paper introduces a new switch delay metric called MIMO latency and presents its justification. The definition of MIMO latency uses the concept of an "ideal" switch, which behavior is the best a switch can do. The frame delay contribution introduced by a switch is thus defined as excess delay over the delay of an ideal switch.
The main goal in designing good metrics for performance testing is that the metrics should be, as much as possible, representative of real network situations. Also they should be independent of switch architecture and test workload. Based on the above criteria, we show the advantage of using MIMO versus other metrics like FILO, LILO and LCD. Also we show that MIMO can be aggregated and explain the meaning of different contributions in the aggregated MIMO. A clear understanding of the different contributions to the total latency is very important in designing networks with latency constraints.
The authors have been involved in ATM Forum Test working groups since 1996 [1, 9] and this paper presents some of their contributions to the Forum.
The next section analyzes why the usual frame latencies based on FILO, LILO and LCD latencies are not appropriate in an ATM environment. In Section 3 of this paper we present the definition of MIMO latency and the concept of ideal switch. In Section 4, we compare MIMO vs. other latency metrics. In section 5 results of test measurement are presented. In Section 6 we discuss about MIMO applicability and its relation with LCD. In Section 7 we present the conclusions of our study.
2. Problem Statement
Some of alternative metrics usually used to measure frame latency as shown in Figure 1 are FILO (first-bit in to the last-bit out) latency, FIFO (first-bit in to the last-bit out), LILO (last-bit in to the last-bit out), and LIFO (last-bit in to the first-bit out) latencies can be easily obtained from Figure1. Unfortunately none of the four above metrics is appropriate for ATM networks[1,2]. So LIFO may result in negative values, FIFO does not reflect the expansion and compression of gabs on output, and LILO depends strongly on the workload. In this paper we will be focusing particularly on FILO, LILO and recently proposed [3] LCD (last cell delay). LCD is a variation of LILO and measures the latency of a frame through a switch by measuring the last-bit-in-to-first-bit-out (LIFO) latency of the last cell of the frame.
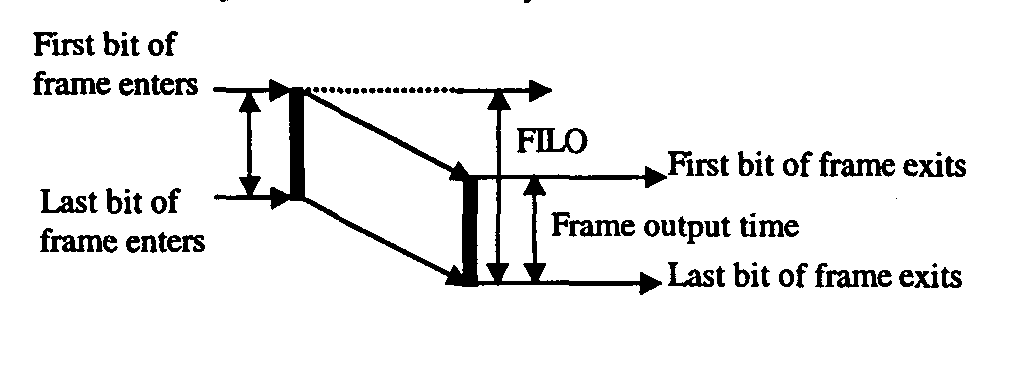
Figure 1.Frame latencies
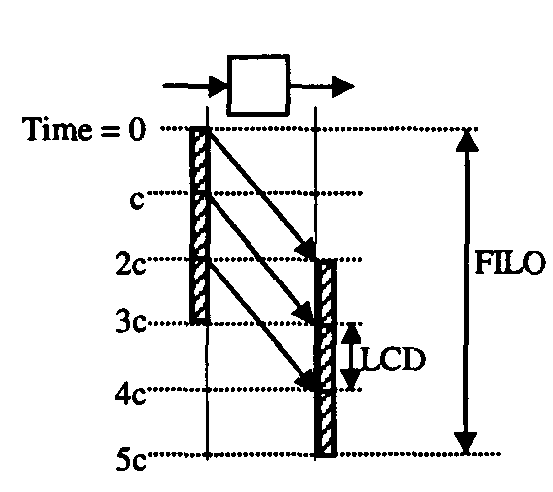
Figure 2.FILO latency
For example, consider a frame consisting of three cells as shown in Figure 2. Let us assume that the input link rate is identical to output link rate and that the cell input or output time is c. The switch introduces a delay of 2c to each cell. As a result, the FILO latency (interval between the first bit in and the last bit out events of the frame) is 5c or in general for this switch behavior and for a n cell frame FILO will be:
FILO = nc + delay
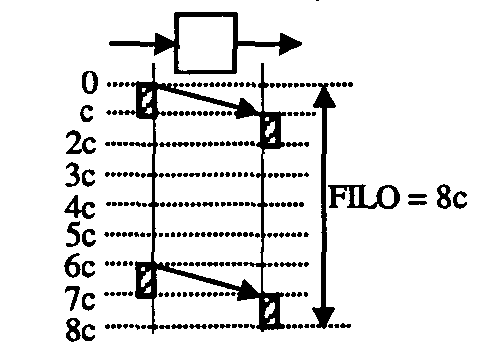
Figure 3a.Delay = c
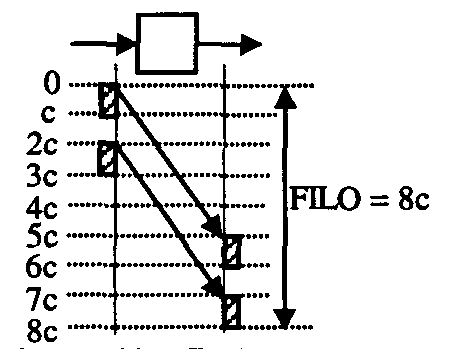
Figure 3b.Delay = 5c
As we see from the example of Figure 2, FILO depends on the length of the testing frame. Figure 3a and 3b shows the dependency of FILO also from the pattern of testing frame. In both Figure 3a and 3b FILO is equal to 8c, but clearly these values are misleading because the switches in Figure 3a and 3b are responsible for delays equal to c and 5c respectively.
Generally, the measured performance of a system depends upon the system as well as the workload. Some metrics are highly workload dependent while others are less dependent. A metric, which depends more on the system and less on the workload, is generally preferred particularly if the users are interested in comparing the systems and not the workloads. It turns out that the FILO frame latency as defined has the undesirable property that it depends heavily on the workload.
Applying the definitions of LILO and LCD for the examples of Figure 2 and 3 we find that:
LILO = delay and LCD = delay - c
So for these examples LILO and LCD depend only on the delay introduced by the switch. The problems with LILO and LCD start when the Output speed of the switch is lower than its input speed. For example, consider an n-cell frame passing through a switch with input speed of x and output speed of x/m. Figure 4a shows this case for n=3 and m=2. At input, each cell time is c, while at the output it is mc. In this case, the last bit of the last cell enters the switch at nc and the first bit of that cell exits at (n-1)mc + delay. The last cell’s LIFO latency or LCD of the switch is (n-1)mc + delay - nc or c(nm-m-n) + delay, and LILO is equal to cn(m-1) + delay, where "delay" is the real delay introduced by the switch and in our example is equal to c. As shown in Figure 4a, for n=3 and m=2, LCD is 2c and LILO is 4c. For n=100, and m=100, LILO and LCD will be 9901c and 9801c respectively.
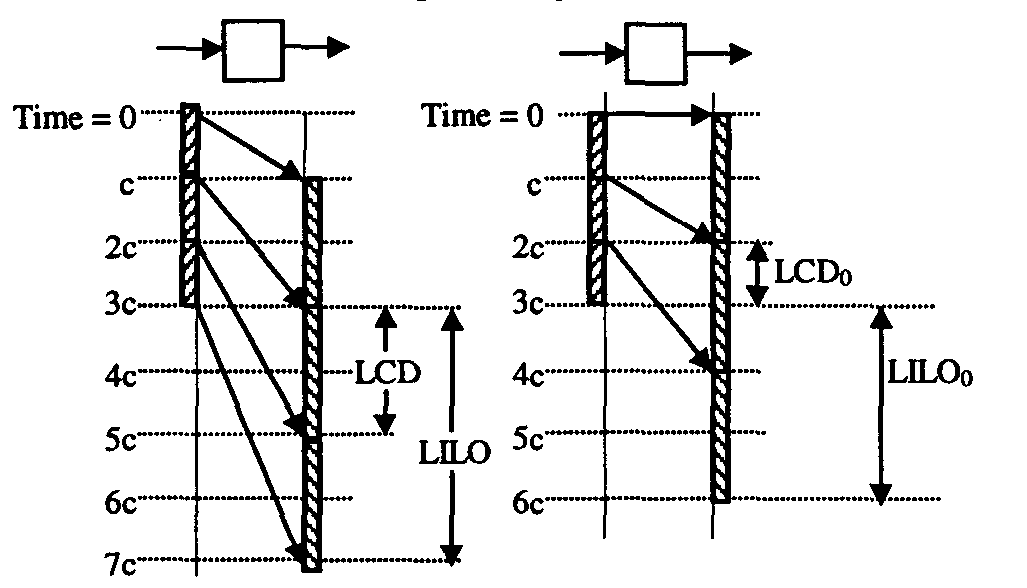
Figure 4: a. LCD latency b. Zero delay switch
So in general for this example we have: LCD = c(nm – m - n) + delay and LILO = cn(m-1) + delay
As is shown in the above relations, both LILO and LCD have an explicit dependency from the measurement load: number of frames n and ratio between output speed and input seed m.
3. MIMO definition and zero-latency switch
We propose a new metric called MIMO (Message In Message Out) latency that measures the true contribution of the switch to the frame latency and is not affected by the arrival patterns (gaps) of the cells constituting the frame. MIMO latency is calculated for any given arrival pattern as the LILO frame latency for the pattern through the ideal switch (LILO0) subtracted from the measured LILO frame latency of the switch under test gives:
MIMO = LILO – LILO0(1)
a. Input Speed < Output Speed b. Input Speed = Output Speed c. Input Speed > Output Speed
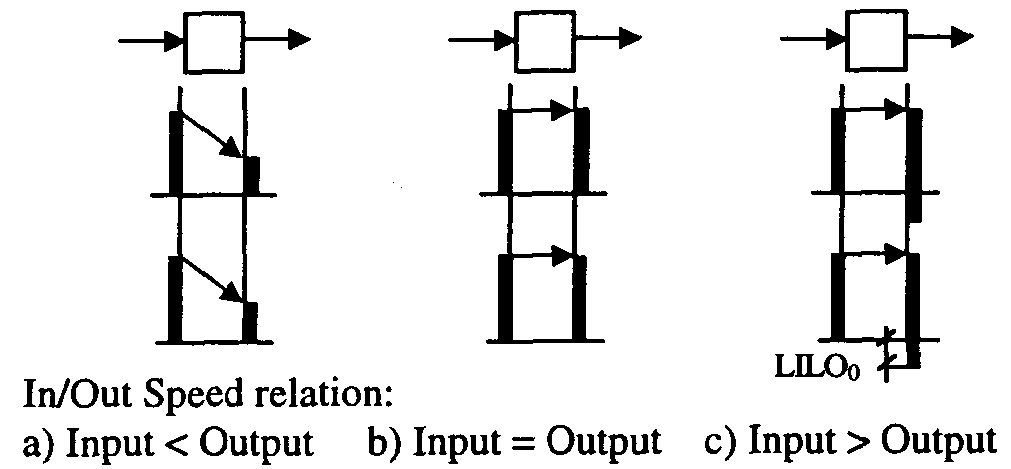
Figure 5. An ideal switch introduces a nonzero LILO latency only when input link speed is greater than the output link speed.
An ideal switch is defined as a switch that handles incoming frames in such way that they are transmitted on the output link without any unnecessary time consumption, i.e. the best any switch can do. By definition, MIMO latency for an ideal switch is zero. Hence, an ideal switch can also be called a zero-delay switch. Figure 5 shows three possible cases of behavior of an ideal switch. The figure shows that LILO0is zero unless input speed is faster than the output speed. The procedure for calculation LILO0when input speed is greater then output speed is as follows:
LILO0= max{t, LILO0} + COT
Where: COT = cell output time = 424 [bits] / Output Link Rate [bits/sec]
Applying the definition of MIMO latency we find for the example of Figure 2 that MIMO is equal to 2c, and for the examples of Figure 3a and 3b is c and 5c respectively. Notice that in each case, MIMO latency reflects the switch behavior and is not affected by the arrival pattern.
LILO0is the latency that the frame would experience if it is passed through the best possible (ideal) switch. In other words MIMO latency is the extra delay introduced by the switch under test compared with its corresponding zero-delay switch. For example, consider the frame and the switch of Figure 4a. Figure 4b shows the output pattern when the frame is passed through an ideal switch. The ideal switch, in this case, sends out the first bit as well as the other bits as soon as it can. As shown in the Figure 4a:
LILO0= 3c
LILO = 4c
MIMO = LILO – LILO0= c
For other values of n and m:
LILO0= n(m-1)c
LILO = n(m-1)c + delay
MIMO = LILO – LILO0= delay = c
So in this case delay = c and MIMO = c
An important point, which needs to be clarified is the influence of Input/Output speeds of the switch. When we change the in/out link speed, we are operating with a different switch. Its measured delay may be very different from that of another switch with almost the same hardware but different I/O speeds. The corresponding zero delay switch is also different. For instance, in the examples given above, LILO with m=2 and m=100 are different. So are LILO0s. The difference between LILO and LILO0is MIMO. MIMO definition shows that MIMO metric doesn’t depend upon the measurement loads. This doesn’t mean that "delay" and MIMO value do not depend for internal implementation reasons upon the measurement loads. If there is a dependence of the delay upon the measurement loads this is an issue for the designer and manufactures of the switch.
Our goal by subtracting LILO0is to subtract out the workload dependent part from the metric so that when comparing multiple switches the results are not overshadowed by the workload dependent part (for example, the part that depends upon n – the frame size).
If the switch would introduce no delay then this is the case an ideal switch shown in Figure 4b. In this case we have:
delay = 0 and LCD = c(nm – m –n)
Let name the LCD of the ideal switch LCD0, so we have
LCD0 = c(nm – m –n)
We can rewrite the expression for LCD as:
LCD = LCD0 + delay
LCD0 is a constant factor that depends on the measurement load and has nothing to do with the delay introduced by the switch. For this reason it is desirable to remove LCD0 from the relation used to measure the switch delay, in this case LCD. This is accomplished by MIMO Latency, which definition does contain no terms explicitly depending on the measurement loads. Note that MIMO latency can be obtained by LCD as:
MIMO = LCD – LCD0
4. Comparing MIMO vs. other Latency Metrics
In this Section we compare MIMO vs. other metrics based on the criteria of accountability, additivity, simplicity and negativity.
4.1 Accountability
Generally, the measured performance of a system depends upon the system as well as the workload. Some metrics are highly workload dependent while others are less dependent. A metric, which depends more on the system and less on the workload, is generally preferred particularly if the users are interested in comparing the systems and not the workloads. It turns out that the FILO, LILO and LCD frame latency as defined in [3] have the undesirable property that they depend highly on the workload. This is obvious from the example shown in Figure 2, 3 and 4. A vendor trying to sell the switch would use small frames, say, n=2, and claim its LCD is zero while a competing vendor will use large frames, say, n=100 and show that the same switch has large delay. Notice that in the example of Figure 4a, LCD = c(nm – m –n ) + delay, LILO = cn(m-1) +delay and FILO = cnm +delay of which c(nm – m –n ), cn(m-1) and cnm are respectively the workload dependent part and the delay = c is the workload-independent (or switch dependent) part.
The dependency of FILO, LILO and LCD metrics on the input frame configuration is not a desirable feature in comparing different switches performances. However, if the workload is given and a user is interested in knowing the total delay introduced for that workload, then any of the measured latencies, including FILO, LILO, or LCD can be used. as an indication of delay in an "in-service" measurement where the user is interested in computing total delay between the entry and exit from a given network.
On the other hand, for out-of-service performance testing, where a user wants to compare multiple networks or switches, MIMO is a better indicator of the switch performance since the workload part has been taken out.
4.2Additivity
In the references [5, 6], it is shown that MIMO latency of a series of components can be computed as follows:
MIMOå= åMIMOi+ åLILO0i–LILO0å(2)
Here, MIMOiis the MIMO latency of the ithcomponent, LILO0iis the LILO latency of the ithcomponent if it were an ideal switch, and LILO0åis the LILO latency of the entire series if it is replaced by a black box consisting of an ideal switch. Note that computing LILO latency of an ideal switch requires knowledge of only the i/o speeds and is trivial in most cases. If the input speed is same or slower than the output speed, the LILO latency of the ideal switch is zero.
LILO and LCD are additive:
LILOå= å LILOi and
LCDå= å LCDi (3)
We have not mentioned the fact that LCD for each component is measured differently depending upon whether it is a switch or a wire. For switches, LCD is defined as the LIFO latency of the last cell of the frame. For wires, LCD is defined as the FILO latency of the last cell of the frame. This change in definitions is required to ensure additivity. Note that a wire must always follow a switch and vice versa.
There are two problems with differing definitions of LCD for switches are wires. First, the LCD latency of a zero-length (or very short length) wire is c (one cell time) and not zero. The latency of a 1 km of fiber would be c+5 ms and not 5 ms. Second, if we put two switches back-to-back the total LCD is not the sum of individual LCDs. Figure 6 shows a concatenation of two switches, with each switch having an LCD of 0, but the LCD of the two switches combined is 2c. In this case, in order to arrive to the right result the user should add the LCD of the intermediate wire, which is defined as the FILO latency of the last cell. Note that this definition is different from the definition of LCD of a switch. The conclusion is that the additivity of LCD is not simple, it requires the use of two different definitions for LCD, depending on the delay element. Note that FILO is not additive.
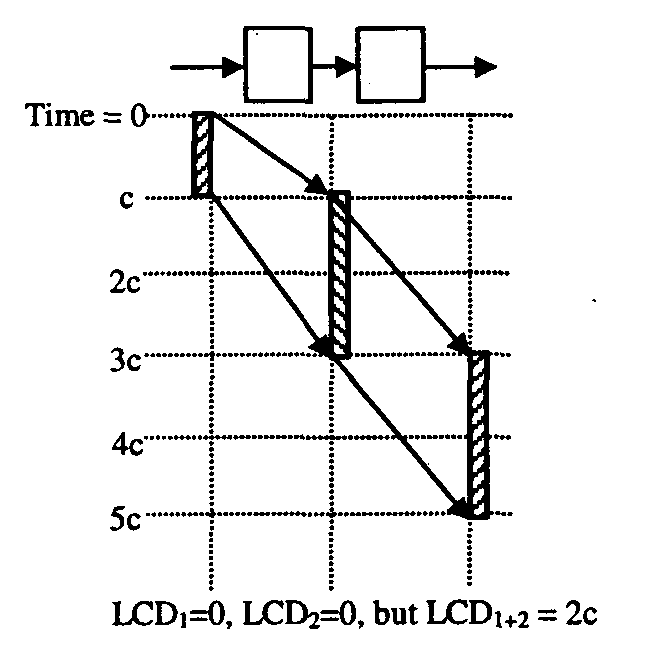
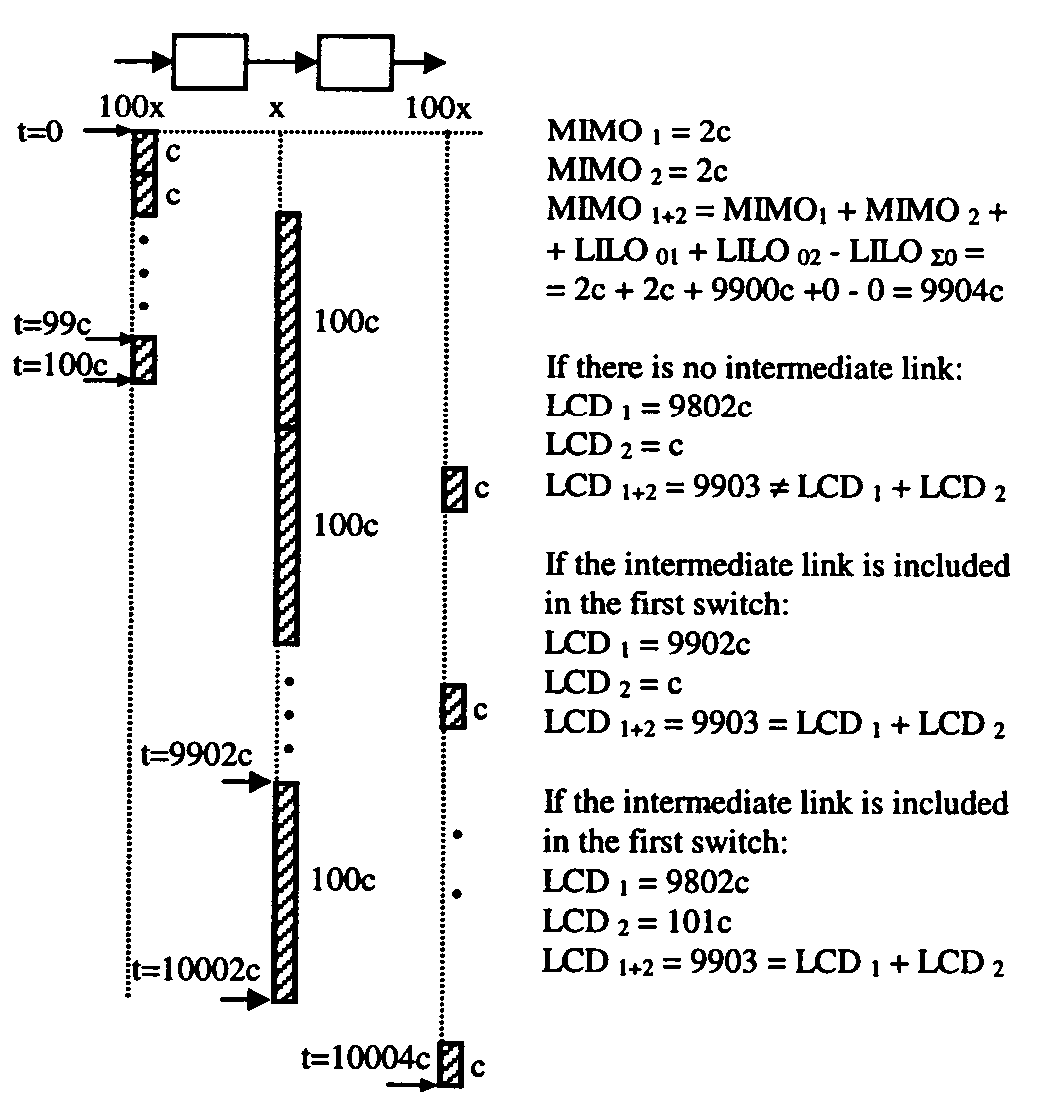
Figure 7 (example 3 of [7]) shows a concatenation of two switches. The first switch has input speed 100 times faster than the output speed. The second switch has output speed 100 times faster than the input speed. Both switches have the property that they unnecessarily delay the cell by 2c times.
As shown, each frame has 100 cells. MIMO latency for both switches is 2c regardless of the number of cells in the frame. LCD latency for the first switch is 9802c and that for the second switch is only c, leading one to believe that the first switch is really bad. In fact, it can be made to look arbitrarily worse by simply changing the workload – number of cells in the frame.
Another point to note from Figure 7 is that while each switch is good, the system consisting of the two switches together has a bottleneck in the middle. This bottleneck is the consequence of the mismatch among the switches link speeds. If there is no special justification this bottleneck is simply the result of bad engineering. This is reflected by the combined MIMO of 9904c. If the bottleneck is improved the MIMO improves. Combined LCD in this case is 9903c. When there is a link between the switches we should apply the additivity of LCD using the using different definitions for LCD of the switches and that of the wire. In [7] is suggested that the first switch includes the edge links and the second switch includes what remains of end to end connection. This may rise another problem, that of arbitrary assignment of the delay to network elements. For example when the intermediate link is included in the first switch we get: LCD1= 9902c and LCD2= c. When the intermediate link is included in the second switch the results are:
LCD1= 9802c and LCD2= 101c.
4. 3 Simplicity
FILO, LILO, LCD and MIMO all are simple. For MIMO, one has to know the input/output speeds of the SUT and the cell arrival pattern to subtract out the workload dependent part. For LCD, one has to properly classify each blackbox either as a switch or a wire and to ensure that wires and switches alternate.
In cases, where one is interested in comparing multiple systems, it is important to subtract out the workload-dependent part and so the knowledge of workload is required. However, if one is interested only in in-service allocation of delays among various components for a given workload, LCD, LILO or FILO may be used.
4.4 Non-negativity
MIMO, FILO and LILO by definition give always non-negative values. LCD can be negative if the first bit of the cell come out of a component before the last bit goes in. For example, a simple digital amplifier that takes in distorted waveform and outputs noise-free square bit pattern will have a negative LCD.
5. Test Measurements with Input Rate Higher Than Output Rate
The test configuration for the LCD, LILO, FILO and MIMO latency measurements for the case with the input link rate higher than the output link rate, isshown in Figure 8 [1, 8]. It uses a 155 Mbps UTP-5 link between the monitor port 1 and the switch port A1 and a 25 Mbps link between the monitor port 2 and the switch port D1. Figure 8 also indicates the traffic flow direction.
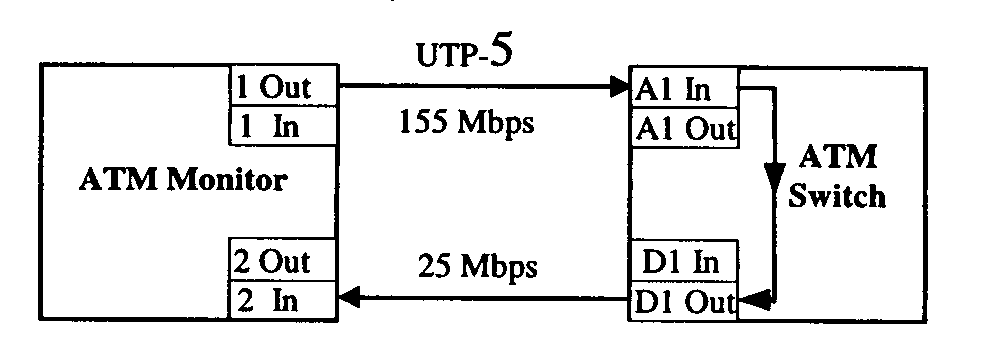
Figure 8.Test configuration for measurements of LCD and MIMO latency
In this configurations:
All tests are performed with 32-cell frames. One of the measurements used contiguous frames, i.e. cells of the test frame were transmitted back-to-back. In the rest of the tests, we introduce identical gaps (unassigned cells or cells of other frames) between cells of the test frame.
Table 1 presents measurement results for eight test runs, from which LCD, LILO, FILO and MIMO latency are calculated. The first test uses a contiguous test frame on input. All other tests use discontinuous frames on input, with gaps between cells of the test frame, as indicated in the second column. Our tests do not show any significant difference if gaps include unassigned cells or cells of other frames, which leave the switch through output links other than the one used by the test frames. The third, fourth, fifth and sixth columns present measurement results for the LILO, LCD, FILO and MIMO, respectively.
Table 1: (All times are in m s)
|
Test No. |
Frame Pattern |
LILO |
LCD |
FILO |
MIMO |
|
1 |
No gap |
385.0 |
368.5 |
563.3 |
33.3 |
|
2 |
1-cell gaps |
295.8 |
279.2 |
561.8 |
31.8 |
|
3 |
2-cell gaps |
209.1 |
192.5 |
562.8 |
32.8 |
|
4 |
3-cell gaps |
119.8 |
103.3 |
561.3 |
31.3 |
|
5 |
4-cell gaps |
44.0 |
27.4 |
560.3 |
30.3 |
|
6 |
5-cell gaps |
33.6 |
17.0 |
562.8 |
19.9 |
|
7 |
6-cell gaps |
35.9 |
19.3 |
652.8 |
22.2 |
|
8 |
7-cell gaps |
35.6 |
19.0 |
740.3 |
21.9 |
Analyzing the results shown in Table 1 is clear that LILO, LCD and FILO are heavily dependent on the input frame configuration. On the other hand MIMO reflects only the delay introduced by the switch itself. In this case the variation of LCD, LILO and FILO could be misleading about the performance of the switch under test.
Note that the switch latency is higher in the first 5 tests due to cell queuing. In the last three tests, the gap between the cells is large and there is no queuing. MIMO latency clearly reflects this effect.
6. MIMO applicability
Based on this analysis we can conclude that MIMO and LCD (or LILO) have advantages and disadvantages. These metrics can be seen as complimentary because they are more appropriate in different applications. MIMO metric is better suited for comparing performance of different switches in out-of-service measurements, where it can precisely measure the delay introduced by the switch independent of the input frame. LCD can be used for in-service measurements and for user perceived delay. In this sense, LCD can take the place of FILO or LILO.
Note that if LCD is used in place of LILO, the following relationship may be useful for aggregation:
For any one component:
MIMO = LCD – LCD0(4)
Note that this relationship applies for both switches and wires. That is, LCD can be FILO or LIFO.
For a network of switches we will have the following expressions:
LCDå = åLCDi (5)
MIMO å = å LCDi- LCD0 å (6)
Where LCD0 å is the LCD of the entire series if it is replaced by a black box consisting of an ideal switch.
Furthermore the expression:
MIMO å = å MIMOi+ å LCD0i– LCD0 å (7)
can be used to relate the delay of the network to the delays of individual switches measured in performance testing by MIMOiand to mismatch between input and output link speeds given by LCD0i.
7. Conclusions
We have shown the advantages of using MIMO instead of other latency metrics like FILO, LILO or LCD in performance testing. In particular MIMO is better suited for out-of-service measurements where one is interested in comparing multiple switches independent of the workload. LCD, FILO or LILO can be used for in-service measurement where one is interested in total delay for a given workload.
References: