| Nolan Zhou, nzhou@wustl.edu (A paper written under the guidance of Prof. Raj Jain) |
Download |
The majority of the world benefits from the green networking initiative, as general consumers will see a drop in costs for energy, while industrial consumers will see significant reductions in operation costs (Mahadevan et al., 2010). This paper will examine two major facets of energy usage that have been focused on by green networking efforts: reducing overall power consumption by networks, data centers, and the Internet, as well as the impact of the average consumer using the Internet.
The energy consumed by electronic devices is a contributing factor to large energy consumption for data centers. According to figures, the total energy consumption of network devices in data centers of the US in 2006 was 61 billion kWh (kilowatt hours). It has been shown that network devices alone consume 20-30% energy in a single data center (Environmental Protection Agency (EPA) 2007).
With global IP (internet protocol) traffic estimated to have increased 500% from 2008 to 2013, at a compound annual growth rate of 40% (Ramos et al., 2010), it is evident that improving efficiency of network routers and data centers will have a tremendous effect. Even marginal improvements to internet infrastructure can result in significant conservation of energy resources. As of 2013, this is not a big issue, but as natural resources continue to deplete, it will become an increasingly important issue.
One type of an increasingly popular method of wireless access is the Wireless Mesh Network (WMN), which provides wireless connectivity through much cheaper and more flexible backhaul infrastructure when compared to traditional wired solutions, such as Ethernet (Amokrane et al., 2012). The nodes of these WMNs are self-organized and self-configured, allowing for flexible changing topology while maintaining Internet access to users through a mesh connective network (Capone et al., 2011).
The traffic requested by TP i is denoted by di. xij represents the assignment of TP i to CS j, while zj is the installation variable related to CS j. Additional binary variables are wjN that show that if a Mesh Access Point (MAP) is installed in CS j, then fji represents the traffic flow on the wireless link (j, l) while fjN is the flow from the MAP to CS j to the Internet. Thus:
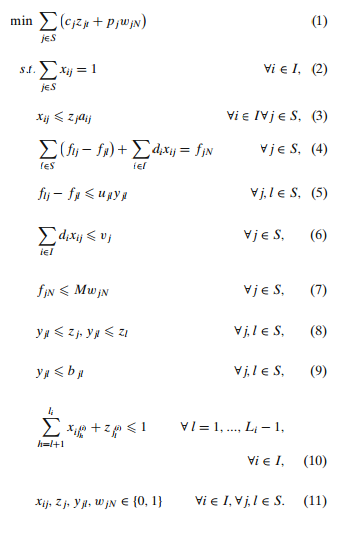
Adapted from "Energy Savings in Wireless Mesh Networks in a Time Variable Context" Capone et al., 2011
Function 1 accounts for the total cost of the network, including installation cost cj and cost pj relating to the connection of the MAP to the wired backbone. Function 2 forces each TP to be assigned to one active CS. Function 4 represents a flow balance set of the equations, while functions 5-7 are capacity constraints for links, routers, and gateways respectively. A wireless link between any two nodes exists only if they are both active, as represented by functions 8-9, and function 10 imposes the assignment of a TP to the nearest active BS, and function 11 restricts the decision variables to take only binary values.The equations demonstrate that there were significant energy savings were achievable by re-assigning active traffic points to active base stations, which eventually results in a 40% reduction in energy consumption for normal conditions, and 30% reduction in heavy traffic conditions (Capone et al., 2011). Therefore, there are significant energy savings to be had by implementing Mesh networks into current active solutions to achieve similar performance with lower power requirements.
Thus, a simple model can be developed as follows:
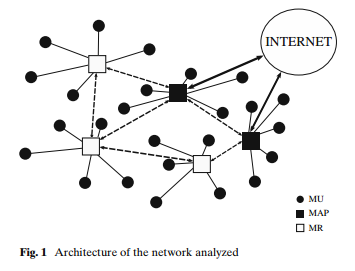
Adapted from "Energy Savings in Wireless Mesh Networks in a Time Variable Context" Capone et al., 2011
Where the Internet is connected to by a few MAPs, which are connected to by some Mesh Routers (MRs), which are in turn accessed by Mesh Users (MUs). This implies that the optimal setting is one where an optimal number of mesh users connect to an optimal number of mesh routers, which in turn connect to mesh access points, resulting in an efficient connection paradigm. This differs from the current schematic of having hundreds, if not thousands of users connecting to hundreds of routers that connect to dozens of internet service providers (ISPs) that adequately connect to the Internet, but do so at the cost of inefficient energy consumption.
The energy used to deliver media content directly to a consumer's computer or television uses approximately 78% of the energy necessary to mail a physical copy to a consumer, but has a carbon footprint that is 100% greater (Seetharam et al., 2010). These values, however, does not account for the cost to ship a rented movie back to a distribution center, nor do they account for the impact that creating physical media has on the surrounding environment.
Adapted from "Shipping to Streaming: Is this shift green?" Seetharam et al., 2010
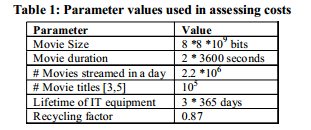
Seetharam et al. assumed that there were 55 regional distribution centers, each having approximately 20000 square feet, with an annual energy consumption of 7.6k W/h (watts per hour) per square foot for each warehouse. It was calculated that the total energy consumption for the shipping of a single DVD was 0.069 MJ. If paper sleeves and plastic cases were recycled, the energy savings were about 64% and 80% respectively. As Seetharam et al. did not find data regarding DVD recycling, they assumed that it was 13%, on par with other IT (information technology) technologies. With these values, the marginal energy cost was calculated to be 0.976 MJ, 0.125 MJ, and 0.1764 MJ for manufacturing a DVD, plastic case, and paper sleeve respectively.The transportation of these DVDs was assumed to have been usually done with a 20,000 lb delivery truck, with an energy cost of 18 MJ/mile for a standard 18-wheeler (Seetharam et al., 2010). These trucks average a lifetime of 155,000 miles, so the energy for transportation of a singular DVD to the distribution center and the last leg to the consumer itself was found to be 0.0403 MJ and 0.0054 MJ respectively, with the total cost of manufacturing the transport truck itself to be 200,932 MJ (Seetharam et al., 2010). By dividing the energy cost of manufacturing the truck by the number of DVDs transported, an additional energy cost of 0.0033MJ was added onto the cost of shipping a DVD, resulting in a total cost of shipping one DVD to be 1.396 MJ. These values are all summarized in Table 2:
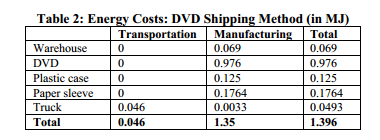
Adapted from "Shipping to Streaming: Is this shift green?" Seetharam et al., 2010
The cost of streaming a DVD was calculated to be 1.1 MJ, which, compared to the 1.396 MJ of packaging and shipping a rental DVD, is a savings of roughly 21.2% in terms of energy. This will be covered more in depth in section 3.3.
There are two scenarios here: a non-energy optimized scenario (e.g. the typical method of deployment currently in use, with everything running at peak power ratings and consumption at all times (Bolla et al., 2013), which is highly inefficient) and an energy-optimized scenario (where recent research results for decreasing the energy consumption of data centers and networking are taken into account, such as implementing the WMNs mentioned previously).
First, the manufacturing costs associated with streaming a video must be considered. An exact analysis of the energy expended in manufacturing servers, hard drives and routers is unfortunately unavailable, as there are dozens of individual products for each category, which would result in little gain for a significant time investment. Therefore, the costs must be estimated from data. Seetharam et al. again assume that 13% of the total energy expended in manufacturing IT equipment is recovered by recycling and that aforementioned equipment has a typical lifetime of 3 years.
If each movie is approximately 8 GB (gigabytes) (the typical size of a dual-layer DVD), then approximately 105 movies can stored per 1 PB hard drive (Seetharam et al., 2010). The manufacturing cost of a disk drive of size 30 GB was 2926 MJ in 2010, and from this value, the authors estimated that the manufacturing cost of one of these 1 PB (pentabyte) data storage units today was 1463000 MJ. By dividing the total energy cost by the cost of a single stream session of a movie, it was calculated that a single streaming of a movie is 0.000528 MJ. The total energy required to manufacture a server was derived from an estimation of the total energy spent in manufacturing a desktop as 5345 MJ (Seetharam et al., 2010), excluding the manufacturing cost of the monitor, as the energy cost for monitors varies depending on the type of monitor. This is logical, as plasma monitors consume significantly more power than TN (twisted nematic) or IPS (in-plane switching) panels.
The authors estimated that the number of server units required to fulfill demand from peak load (listed in Table 1) to be 42151. The energy cost of streaming a single instance of a movie was calculated to be 0.081 MJ. To obtain the manufacturing energy cost of a router, the authors scaled the value obtained for the desktop proportional to the average weight of a router. They assumed there were 15 routers in the path, and consequently, the energy cost for streaming a movie is 0.05 MJ, and the total manufacturing cost of the data center and router was found to be 0.1315 MJ (Seetharam et al., 2010).
The cost of manufacturing a home router was found to be 258 MJ, with the monthly median traffic flowing through a home router calculated to be 4 GB (Seetharam et al., 2010). If the average consumer streams 5 movies in a month, this would result in 40 GB of traffic being generated by movie streaming alone. Thus, the costs were calculated by a percentage of time used for any given service. Under a cost-assignment model, the energy cost was calculated to be 0.0177 MJ (Seetharam et al., 2010).
As a conventional 1 PB storage unit consumes 864.2 kW (kilowatts), the energy consumed by a single streaming of a movie was calculated to be 0.03393 MJ (Seetharam et al., 2010). Assuming the servers used to stream are standard-grade servers (e.g. no custom modifications to common, mass produced units), the total energy that would be consumed by a server for a single streaming of a movie was found to be 0.415 MJ, and the energy spent for streaming an 8 GB movie by the routers in use was 0.128 MJ (Seetharam et al., 2010). For the sake of simplicity, all routers were assumed to be the same, with each edge and backbone router consuming 400 W at 10 Gbps (Gigabits per second) and 1600 W at 40 Gbps respectively (Seetharam et al., 2010).
To find the energy consumed by servers, the total energy cost required for operating servers and storage in a day would be divided by the assumed 2.2 million movies streamed during any given day. For routers, the total energy consumed is the sum of the energy required to transmit the 8 GB movie and the idle state energy amortized over the total traffic flowing through the router in a day (Seetharam et al., 2010). The total traffic flow of the router would be determined by the utilization of the router.
Adapted from "Shipping to Streaming: Is this shift green?" Seetharam et al., 2010
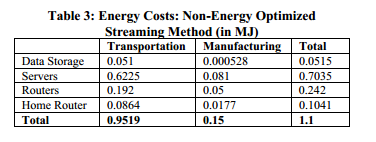
Like the calculations for DVD mailing and the associated warehouse overhead costs, data center operations also have overhead costs (e.g. cooling and maintenance). To incorporate the cooling and infrastructure costs for the above equipment, Seetharam et al. assumed a Power Usage Effectiveness (PUE) of 1.5. Thus, all values in Table 3 above are obtained by scaling transmission energy costs for storage, servers and routers by 1.5. Each home router is assumed to consume 0.0864 MJ in two hours, as per the manufacturer's specification (Seetharam et al., 2010). Combining all the calculated data, streaming a movie was found to cost 1.1 MJ. As 1.1 MJ consumed for streaming is less than 1.396 MJ consumed for manufacturing and shipping a DVD, it can be seen that streaming is more efficient, but not by a significant margin. This was briefly mentioned in section 3.1, and will be analyzed in section 3.3.
Adapted from "Shipping to Streaming: Is this shift green?" Seetharam et al., 2010
Adapted from "Shipping to Streaming: Is this shift green?" Seetharam et al., 2010
As seen from the two tables, it can be seen that the energy consumption of shipping physical media has low transportation costs, but high manufacturing costs. The inverse is true for digital distribution, where the bulk of the cost is incurred by transportation, with marginal costs incurred for manufacturing.Overall, streaming consumes 21.2% less energy than physical media distribution. This, however, is still calculated using "non-energy optimized streaming methods," which is essentially the current method in practice as of 2013. With wireless mesh networks being able to reduce energy consumption by a staggering 40%, it is theoretically possible to reduce the distribution of digital media down to 0.66 MJ per use, which would be an astounding 47.3% energy consumption difference.
This shows the real-world benefits of implementing proposed technological updates in a real world scenario. By eliminating physical media rentals altogether, the system is already optimized to consume 21.2% less energy. By reducing the energy consumption necessary to support the remaining distribution avenue, it is possible to further reduce the 21.2% to 47.3%. It is possible to support almost double the distribution and consumption in the system if just one of the recent proposed solutions to reduce energy consumption is implemented.
Wireless mesh networks (WMNs) are just one of many potential solutions to combat the increased carbon footprint and energy usage of expanding networks. In this section, two major concepts to reduce energy consumption and carbon emissions will be explored: a network paradigm that utilizes delay tolerance established by Internet services, and the implementation of the green concepts of multi-input, multi-output, multi-rate, multi-carrier systems, short-range low-power communications via smaller cell networks, and machine to machine communications.
There are challenges with upgrading any existing technology to a newer standard, however. The key challenge is achieving or improving performance while reducing energy consumption, as this is an "ideal" situation that is difficult to achieve (Bolla et al., 2013). Hybrid cars and electric cars are examples of much more mature technologies that have yet to complete this challenge.
Hybrid cars, such as the Prius, are more fuel efficient, but sacrifice vehicular performance to achieve an environmentally friendlier vehicle. Electric cars similar to the Tesla offer stellar fuel efficiency and are equipped with engines capable of substantial performance, but are triple the cost. Therein, electric cars are the closest parallel example to the aforementioned challenge. It is possible to establish a new infrastructure, or upgrade an existing one, to a much more energy efficient standard, but comes at a tremendous financial cost. Logically, few companies are willing to incur this charge, as it would be a significant negative asset in quarterly fiscal records.
Whenever a signal is sent over a significant distance, a delay is inevitably built in, due to the physical distance the signal needs to travel. Ping is a common method of determining the delay caused by distance, where larger ping is due to either poor connectivity (which can be caused by spotty connectivity to the router or ISP (internet service provider), or an overtaxed network), or longer physical distance (such as transcontinental or interplanetary communications).
Kolios et al. discovered that increased speed achieved a faster convergence, but at the expense of substantially reduced mobility of terminals. By adjusting the distance between infrastructure nodes, it is possible to increase network performance speeds, while reducing the energy needed to achieve said results. Unsurprisingly, however, these performance gains reduced dramatically when placed in a high-density urban setting, as the nodes were frequently overtaxed or under heavy load (Kolios et al., 2011).
By utilizing decentralized postponement algorithms, Kolios et al. concluded that it'd be possible to significantly improve system performance. Delaying data transmissions by a single hop (where a hop is defined as each time data is forwarded to a new router) resulted in mobile users exceeding 33x reductions in energy consumption. By increasing delay in the end-to-end path, no excess energy is consumed, as cell switch-off reduces the amount of network energy consumed on the communication link without affecting its efficient (Kolios et al., 2011).
The simple two-hop relaying scheme was studied by Kolios et al. that was fairly simple to implement, and reduces energy consumption 15x compared to current technologies. As a result, implementing delay tolerance into single- or multi-hop cases resulted in universal decrease of energy gains, while having marginal to significant gains to performance (Kolios et al., 2011). By capitalizing on the inherent delay built into sending signals across physical cables, it is possible to reduce the energy consumed by routers awaiting the receipt of the signals.
It is simplest to design green wireless networks by first examining energy efficiency metrics to determine how much of the network is actually green (Chen et al., 2013). IPMVP (International Performance Measurement and Verification Protocol) was proposed by EVO, the Efficiency Valuation Organization (Chen et al., 2013). This standard would set a new standard for measuring efficiency by introducing an Energy Consumption Rating (ECR) and Telecommunication Energy Efficiency Ratio (TEER), which was proposed by the Alliance for Telecommunications Industry Solutions (ATIS) to calculate the ratio of actual system output to the energy consumption of the system (Chen et al., 2013). By standardizing the measurement standards of energy efficiency, it would no longer be possible to conceal data, which promotes transparency and pressures energy inefficient standards to change.
Reducing the number of base stations (BS) running at any given point can conserve power, and can be considered as a dynamic adjustment in network planning (Chen et al., 2013). Turning off base stations has its downsides, however. There is risk of coverage holes, nearby base stations should be configured to compensate for the coverage hole. This is a simple solution on paper, and is equally simple to implement. Of all the inner-network solutions, reducing the number of active base stations is perhaps the cheapest and easiest to implement (Shang et al., 2010).
Machine-to-machine (M2M) communications are an emerging technique in the Internet of Things (IoT) (Chen et al., 2013), and consequently, it is becoming increasingly important to ensure that energy consumption is not an issue as M2M matures. By adjusting the transmission power down to the minimum level necessary to run, and implementing "green" protocols (such as routing protocols, sleep scheduling algorithms (Chen et al., 2013), or WMNs) energy consumption will naturally fall, which will reduce global emissions and the carbon footprint. Additionally, it is possible to reduce the measurements of M2M devices while they are in a sleep state, where M2M devices do not communicate, but should still measure neighboring device cells at least once, per a Discontinuous Reception (DRX) period (Chen et al., 2013). Since they do not require any mobility support, it is not as difficult to implement M2M "green" methods either.
Lastly, multi-input/output (MIMO) systems, multi-rate networks, and multi-carrier systems all hold their own place in green networking. MIMO and multi-carrier systems both have improved significantly over the years. Diverse channel coding and modulation schemes have been studied, such as beanforming, space-time coding and processing, spatial multiplexing and cooperation, etc. (Chen et al., 2013). These methods compliment WMNs very well, and are able to improve performance of WMNs by a further 10% (Chen et al., 2013), (Fisher et al., 2010).
Multi-rate networks have a modulation adaption at the physical level, which sends wireless networks multiple transmission rates (Chen et al., 2013). The challenge in this implementation is to choose multi-rates based on the conditions of the network and the channels. A cross-over layer design is the most popular variation, where green methods of reducing overheads to minimize wasteful energy consumption is still important.
Thus, it is possible to aggregate numerous smaller changes inside current networks to facilitate a global energy reduction inside a network. Individually, these changes are not difficult to implement, either. They are just another alternative to the numerous options that are available for green networking supporters to consider.
It can be seen that WMNs have great potential to trigger sweeping changes to the current systems in place, with potential to nearly halve energy consumption while retaining similar levels of performance. Reform, however, is not the only option. It is possible for both consumers and distributors to implement change. If movie rental services like Netflix and Redbox switch from physical media distribution to purely network-based digital delivery, the carbon footprint of humans is reduced, as the demand for plastic cases, multimedia DVDs, gas, and trucks are all sharply reduced, or eliminated.
On the side of the distributors, if changes are made inside the networks themselves, small energy savings can quickly add up and result in a fairly significant energy savings. The options for green networking are plentiful; all it takes is the initiative to implement the strategies that exist. New technologies are being developed consistently, but old technologies can also be modified and adapted to serve as interim solutions.
2. "Anand Seetharam, Manikandan Somasundaram, Don Towsley, Jim Kurose, and Prashant Shenoy. 2010. Shipping to streaming: is this shift green?. In Proceedings of the first ACM SIGCOMM workshop on Green networking (Green Networking '10). ACM, New York, NY, USA, 61-68.
3. "Antonio Capone, Filippo Malandra, and Brunilde Sanso. 2012. Energy Savings in Wireless Mesh Networks in a Time-Variable Context. Mob. Netw. Appl. 17, 2 (April 2012), 298-311.
4. "Fernando M.V. Ramos, Richard J. Gibbens, Fei Song, Pablo Rodriguez, Jon Crowcroft, and Ian H. White. 2010. Reducing energy consumption in IPTV networks by selective pre-joining of channels. In Proceedings of the first ACM SIGCOMM workshop on Green networking (Green Networking '10). ACM, New York, NY, USA, 47-52.
5. "Frederic Giroire, Joanna Moulierac, Truong Khoa Phan, and Frederic Roudaut. 2012. Minimization of network power consumption with redundancy elimination. In Proceedings of the 11th international IFIP TC 6 conference on Networking - Volume Part I (IFIP'12), Robert Bestak, Lukas Kencl, Li Erran Li, Joerg Widmer, and Hao Yin (Eds.), Vol. Part I. Springer-Verlag, Berlin, Heidelberg, 247-258.
6. "L. Chen, W. Wang, A. Anpalagan, A. V. Vasilakos, K. Illanko, H. Wang, and M. Naeem. 2013. Green Cooperative Cognitive Communication and Networking: A New Paradigm for Wireless Networks. Mob. Netw. Appl. 18, 4 (August 2013), 524-534.
7. "Priya Mahadevan, Sujata Banerjee, and Puneet Sharma. 2010. Energy proportionality of an enterprise network. In Proceedings of the first ACM SIGCOMM workshop on Green networking (Green Networking '10). ACM, New York, NY, USA, 53-60.
8. "Raffaele Bolla, Roberto Bruschi, Olga Maria Jaramillo Ortiz, and Paolo Lago. 2013. The energy consumption of TCP. In Proceedings of the fourth international conference on Future energy systems (e-Energy '13). ACM, New York, NY, USA, 203-212.
9. "Srinivasan Keshav and Catherine Rosenberg. 2010. How internet concepts and technologies can help green and smarten the electrical grid. In Proceedings of the first ACM SIGCOMM workshop on Green networking (Green Networking '10). ACM, New York, NY, USA, 35-40.
10. "United States Environmental Protection Agency. ENERGY STAR Program. Report to Congress on Server and Data Center Energy Efficiency Public Law 109-431. Report to Congress on Server and Data Center Energy Efficiency Public Law 109-431. United States, 2 Aug. 2007. Web. 28 Nov. 2013.
11. "Will Fisher, Martin Suchara, and Jennifer Rexford. 2010. Greening backbone networks: reducing energy consumption by shutting off cables in bundled links. In Proceedings of the first ACM SIGCOMM workshop on Green networking (Green Networking '10). ACM, New York, NY, USA, 29-34.
12. "Yunfei Shang, Dan Li, and Mingwei Xu. 2010. Energy-aware routing in data center network. In Proceedings of the first ACM SIGCOMM workshop on Green networking (Green Networking '10). ACM, New York, NY, USA, 1-8.
| ATIS | Alliance for Telecommunications Industry Solutions |
| BS | Base Station |
| CS | Candidate Site |
| DRX | Discontinuous Reception |
| DVD | Digital Versatile Disc |
| ECR | Energy Consumption Rating |
| EPA | Environmental Protection Agency |
| EVO | Efficiency Valuation Organization |
| g | Gram |
| GB | Gigabyte |
| Gbps | Gigabits per second |
| ICT | Information and Communication Technology |
| IoT | Internet of Things |
| IP | Internet Protocol |
| IPMVP | International Performance Measurement and Verification Protocol |
| IPS | In-plane Switching |
| ISP | Internet Service Provider |
| IT | Information Technology |
| km | Kilometer |
| kW | Kilowatt |
| kWh | Kilowatt hours |
| M2M | Machine-to-machine |
| MAP | Mesh Access Point |
| MIMO | Multi-input/multi-output |
| MJ | Megajoule |
| MR | Mesh Router |
| MU | Mesh User |
| OECD | Organization for Economic Cooperation and Development |
| PB | Pentabyte |
| PC | Personal Computer |
| PUE | Power Usage Effectiveness |
| TEER | Telecommunication Energy Efficiency Ratio |
| TN | Twisted Nematic |
| TP | Test Points |
| W/h | Watts per hour |
| WMN | Wireless Mesh NEtwork |