| Chao Wang, chaowang@wustl.edu (A paper written under the guidance of Prof. Raj Jain) |
Download |
It is expensive to build and run a data center that meets today's need, and how to reduce capital/operational expenditures has become increasingly important. From the viewpoint of data center networking, two of the main related research issues are server interconnections and energy efficiency. Among thousands of servers and switches in today's data center, it is crucial to interconnect them for best utilization. At the same time, it is equally important to achieve energy efficiency for the data centers at such scale. This report introduces research works in these fields in the last two years.
Keywords: Data Center Networking, Optical Switching, Energy Efficiency, Nonoptical Interconnections, Host-Network Joint OptimizationData Center networking (DCN) is about how to connect devices such as servers and switches to enable efficient information exchange in a data center (for example, adding new meta data to a system that predicts the weather in the U.S., or executing a query for the most popular type of clothes in season). As the number of devices in a data center grows to tens of thousands, it becomes difficult to build and maintain these networks. The conventional FatTree architecture may not be suitable in today's large-scale data centers, because FatTree has a high ratio of the number of switches to the number of servers (thus requiring larger numbers of switches), and FatTree needs switches with many ports (thus requiring expensive switches).
With so many devices installed in data centers, however, only small numbers are actively participated in business. According to IBM's documentation in 2013 [IBM13], there are 32.6 million servers worldwide, but 85% of them are idle. As suggested, there is large room for improving energy efficiency in data center networking. For example, we may turn off some idle devices to save energy. A research issue following this line is that we may aggregate the traffic flows, i.e., adjusting the routing paths, thus leaving more idle devices that can be safely turned off. In addition, it is also possible to migrate VMs (Virtual Machines) and put them in a smaller set of servers.
This report introduces recent research works regarding DCNs and energy efficiency. The organization is as follows. Since the use of optical devices in DCNs has been emerging [Che13, Che12, Vah12]. we give a whole section on that topic (Section 3). Before that, in Section 2 we introduce the design of some recent nonoptical DCIs. Issues regarding energy efficiency are presented in Section 4. Finally, Section 5 concludes the report.
The FatTree architecture [AF08] has been used in many data centers because it allows nonblocking transmission and it provides equal bisection bandwidth at each layer of switches. But it is nontrivial to build a FatTree in a large-scale fashion. The number of ports required by each server increases as the FatTree grows larger, and the cabling work will be hard to manage. Therefore, data center researchers are looking at other possibilities to build a scalable DCN.
In one research direction, data center researchers propose a modular way to build DCN. This result in a recursive structure, where one can start from a small and simple network topology and incrementally add devices to it, in a way that the resulting structure resembles its smaller version. The advantage is that this type of DCN is easy to maintain, as one can have a homogeneous set of servers and switches. In another research direction, researchers are seeking ways to flatten the network topology, i.e., to reduce the number of layers above top-of-the-rack switches (ToRs). The advantage is that the resulting data center has good scalability: for the same number of servers, it may require less number of switches and links. We present works towards these two directions in the following subsections.
C-Cell offers a recursive way to build DCN [Cai13]. The advantages of C-Cell architecture are twofold: 1. each server only needs three ports, and the required number of ports for switches are also small (detailed below); 2. C-Cell has a small ratio of the total number of switches to the total number of servers, which implies less investments on building data center infrastructures.
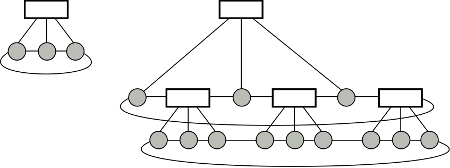
Figure 1: The structure of C-Cell.
The C-Cell architecture is essentially a k-nary tree (Figure 1), where each level of nodes forms a 2D torus network (each device is connected to two others, and the overall topology resembles a circle). In Figure 1, each gray circle represents a server, and each block represents a switch. The basic module of C-Cell, called C-Cell0, is shown at the upper right. C-Celli+1 can be constructed from C-Celli by inserting C-Cell0s between the leaves of C-Celli. Each pair of leaves can include one C-Cell0 in between. Finally, we merge all torus located at the leaves of the newly constructed tree, and the result is a C-Celli+1. For example, the right of Figure 1 gives a C-Cell1. Using this way to construct DCN, each server needs 3 ports, and each switch needs 3+2=5 ports.
In general, let Vn be the number of the servers in a C-Celln; Sn, the number of switches; k, the number of servers in a C-Cell0. We have Vn = Snk = sum ki+1 (i = 0 to n and n >= 0) [Cai13]. Suppose k=6 and n=4. Using C-Cell architecture the switches/servers ratio is 0.167 (1555/9330), outperforming the BCube, which has ratio 0.367 (2850/7776).
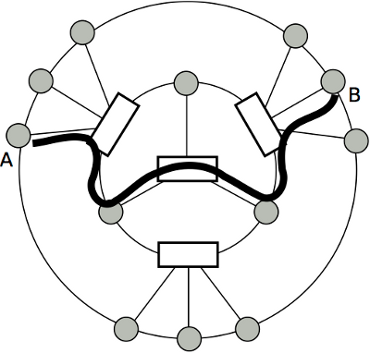
Figure 2: An example of routing data from server A to server B.
The routing in C-Cell is performed by first forwarding the packet to the root of the k-nary tree, and then passing the packet to the destination. Figure 2 shows a physical topology deployment and a routing path from server A to server B. Devices on each level of the k-nary tree can be arranged in a circle, where each device has equal physical distance in between. Using this routing scheme, the implication is that the traffic bottleneck will be at the inner circles. The authors propose that the performance can be improved by replacing the servers at the inner circles with switches.
The layout of a FlatNet resembles a n2-by-n matrix: each column represents n2 servers that are divided into n groups, where all servers in each group are connected by a n-port switch; each row represents n servers that are connected by a n-port switch. The rule of interconnection is as follows. Within the ith column, the xth switch (1 <= x <= n) will connect its jth port to the kth row, where
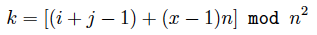
if 1 <= j <= n/2+1, and

if n/2+1 < j <= n.
For example, Table 1 lists the port mapping of a n=2 FlatNet, and Table 2 shows the mapping when n=3. Figure 3 shows two equivalent layouts of a n=2 FlatNet, where each gray circle represents a server; on the left, each dotted circle indicates a switch, and the servers it covers is connected by the corresponding switch; on the right, each square indicates a switch. Finally, Figure 4 shows a layout of a n=3 FlatNet.
Table 1: Port Mapping in the n = 2 FlatNet
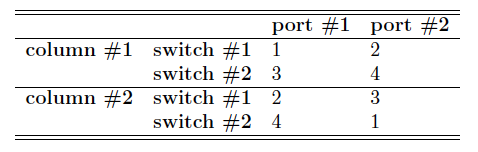
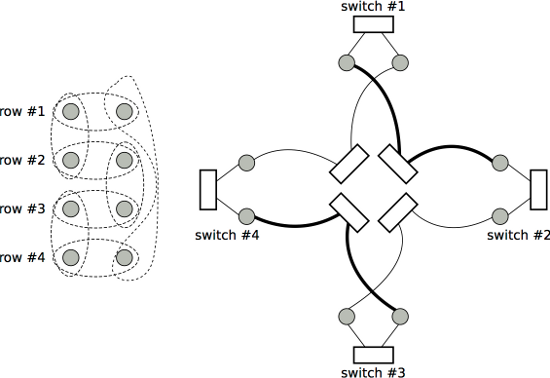
Figure 3: The topology of FlatNet when n = 2.
Table 2: Port Mapping in the n = 3 FlatNet
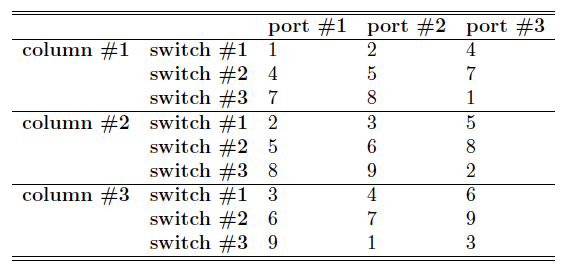
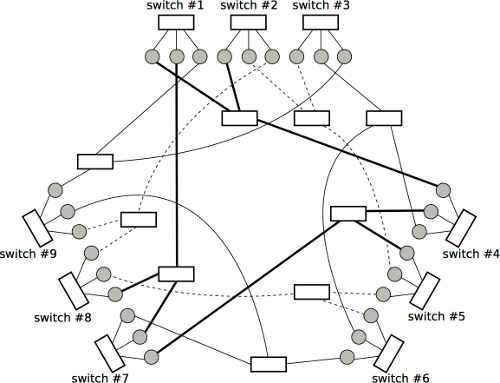
Figure 4: The topology of FlatNet when n = 3.
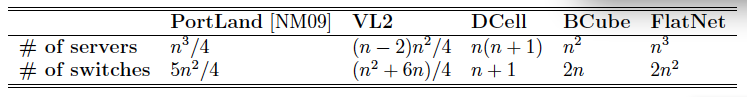
Table 3 lists the properties of different DCN architectures (assuming that each architecture uses n-port switches), including the number of servers they can support and the number of required switches [Lin12]. It shows that FlatNet can support about four times of servers than does VL2, and FlatNet also has lower ratio of switches/servers.
Table 3: Properties of Different DCN Architectures
High-speed and low-operation-cost are two of the main advantages of using optical devices. An optical circuit switch can process an incoming signal and send it out within 12 ms; the power consumption per port is 240 mW (in an electrical packet switch it is 12 W) [Vah12]. In the following subsections, we first review some optical devices involved in DCN and then introduce OSA [Che12], a recent proposal on optical switch architecture.
The following four types of optical devices are used in OSA [Che12]. A Wavelength Division Multiplexer/Demultiplexer (WDM) is used for aggregating forty of more optical channels into one, and the resulting optical channel can be transmitted in one optical fiber. A Wavelength Selective Switch (WSS) takes the incoming optical channel, typically the output of a WDM, and divides it into k set of wavelengths. Then each set is sent out via one of the k output ports. An Optical Switching Matrix (OSM) is a k-input, k-output switch. Optical channel from any input port can be directed to any output port. An Optical Circulator can help in reducing the demand on the number of ports in a optical switch. It has three ports, where two of them are directional: one serves as the input towards the switch; the other, the output from the switch. The remaining one port is connected to the switch and is bidirectional. Therefore, it only takes the switch one port to handle traffic in both directions.
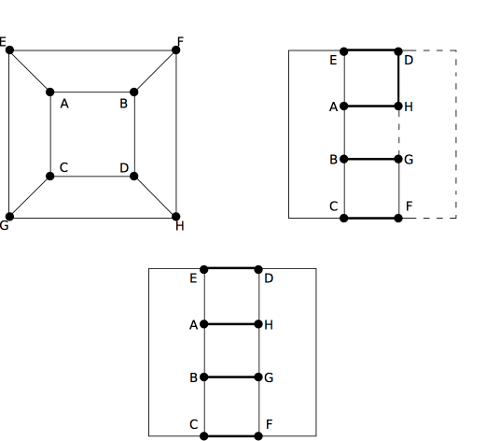
Figure 5: Different ways to connect eight ToRs.
OSA offers a way to dynamically adjust the interconnection of servers to meet dynamic bandwidth demands [Che12]. Sometimes the original topology of ToRs cannot offer the required bandwidth. For example, the topology shown in the top-left in Figure 5 allows the following four pairs of communications: {(A,H),10}, {(B,G),10}, {(C,F),10}, {(D,E),10}, where the number represents the bandwidth requirement (in Gb). Each pair requires 10 Gb bandwidth. But if another pair of communication takes place, i.e., {(C,E),10}, then this will congest at leas one link. There will be no congestion, however, if we reconnect ToRs like one shown at the bottom of Figure 5. Later on, if another pair of communication happens, this time {(D,H),20}, then we can simply decrease to zero the capacity between H and G and between D and F, respectively, and increase to twenty the capacity between D and H. The above shows that the way we connect ToRs matters, and the capability of dynamically reallocating bandwidth can save time for reconnecting ToRs.
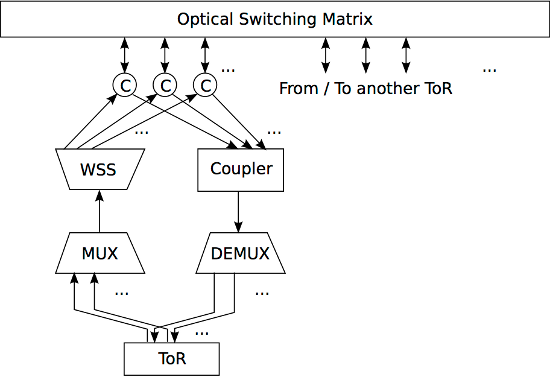
Figure 6: The architecture of OSA.
In OSA, ToRs are connected together via an optical switch matrix (Figure 6). Each output port of a ToR is connected to a optical multiplexer (e.g., WDM), which aggregates all inputs into one, and the output of the multiplexer is in turn connected to a WSS. At the WSS, optical signals are redirected to certain channels based on their wavelengths. Similarly, each input port of a ToR is an output of a de-multiplexer, which takes the output of a coupler. A coupler functions like a multiplexer, but with simpler structure. Finally, before being connected to the optical switching matrix, both the inputs of the coupler and the outputs of the WSS are connected to a series of optical circulators. This simplifies the interconnect to the optical switching matrix, as a circulator allows bidirectional optical transmissions.
Suppose we connect each ToR to k other ToRs, and there are N ToRs in total and each WSS can operate on W wavelengths. Then we need a N*k-port OSM, and this configuration can include NW servers in total. For example, if k = 4, N = 80, and W = 32, the corresponding OSA can support 2560 servers, and it requires a 320-port OSM.
To adapt the interconnection to dynamic bandwidth demands, OSA includes a centralized manager unit that configures the OSM and WSS and determines the appropriate bandwidth to each ToR.
In a highly-connected data center, usually all devices (servers, switches, etc.), if not faulty, are turned on and thus consume energy, because it is hard to say whether some devices will need to be participated in some traffic flow. But as mentioned previously, in practice only a few devices are working at a given time [IBM13]. Therefore, huge energy can be saved if we can power off those idle devices.
To achieve the above goal, it is helpful if we can adjust the traffic routing so that traffic flows are passing through a certain set of devices. In that way, we may power off more devices since less devices are participated in packet forwarding. As VMs are increasingly populating the data center (42% more per year [IBM13]), by migrating VMs to proper servers we can as well reduce the number of servers that need to be on and running.
In the follow subsections, we first review the energy consumptions of four types of data center interconnections and the ratio of energy saving if we apply 1. an energy conservation scheme that powers off idle devices, and 2. an energy-aware routing protocol that minimize the number of devices needed for traffic flow. Then we introduce an energy conservation approach that optimizes the number of devices participating in traffic flows.
In this subsection, we present the study by Shang et al. [Sha12]. In the study, the data center interconnections including FatTree [AF08], VL2 [Gre09], BCube [Guo09], and DCell [Guo08] are compared for their energy efficiency. For the purpose of comparison, the authors fix the network throughput and the routing diameter. Because different architectures, in their original versions, use different routing protocols, applying the same protocols offers a common ground for comparison. Two routing protocols are applied to each of the four architectures.
The first routing protocol is called High-Performance Routing (HPR) [Sha12]. For each pair of end points, HPR first finds a set of routing paths and then selects the path that includes the minimum number of paths crossing it. This heuristic may balance the load of the data center network and achieve higher throughput. If there are multiple paths that are equally loaded, the algorithm will pick the shortest one.
The second routing protocol used in comparison is named Energy-Aware Routing [Sha10]. It can reduce the number of devices involved in routing, while it can make sure that the network has at least a predefined throughput. The Energy-Aware Routing first uses HPR to compute a set of routing paths. Then it removes network devices from the routing paths until the throughput equals a predefined value, starting from the lightest-loaded devices. Then the algorithm uses HPR again to compute routing paths among the new network topology.
The setup is as follows. The authors use 1 Gbps switches in FatTree, Bcube, and DCell; for VL2, 10 Gbps intermediate/aggregate switches and 1 Gbps ToRs. All four architectures use 1 Gbps NICs. For the energy consumption, a 1 Gbps switch takes 4 W per port, a 10 Gbps switch takes 15 W per port, and a Gigabit NIC takes 2 W per port. In the sleeping mode we may save 50% of energy consumption per port. The traffic pattern we consider here is single-source, single-destination. This pattern appears in many operations: for example, executing a query to a database or performing a write operation.
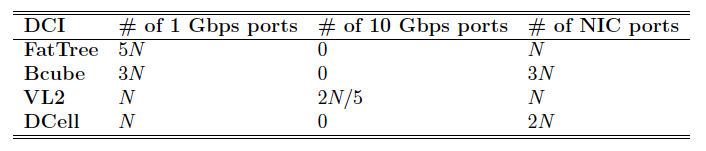
In the comparison of maximum network power consumption, the authors assume that all devices are turned on without using any power-saving scheme. Therefore, in this case the total power consumption is calculated by counting the number of each type of port used in a data center interconnection and multiplying these numbers by the corresponding power consumption. Table 4 gives the number and the type of ports required in each DCN [Sha12], where N is the number of servers. In this sense, FatTree has the largest overall power consumption, and DCell has the smallest. For example, suppose there are 10,000 servers. FatTree will consume about 220 KW; DCell, 80 KW.
Table 4: Port Requirements in the Four DCNs
Next, the authors study the percentage of reduction on power consumption in DCNs with power-saving scheme. The power-saving scheme considered here assumes that a device can be powered off if there is no traffic flowing through it. In the case where a DCN has 10,000 servers, DCell has the worst power saving rate under both 90% and 50% network load (0% saving) using HPR routing; in DCell, less number of devices can be powered off, because HPR can exploit multiple paths in it. In general, Bcube has the best power-saving rate if using HPR---if the network load is under 50%, for example, the power-saving rate is about 20%.
Finally, if using Energy-Aware Routing, FatTree has best power-saving rate under lower network loads. Under 40% of network load among 8,000 servers, for example, FatTree can save 50% of energy consumption; VL2 and Bcube, 55%; DCell, 40%. The result of this study suggests that power-saving techniques can save significant amount of energy consumption in DCNs. In the following subsection we present a recent work on such techniques.
Optimization for energy efficiency can be approached from two different angles. A host-side optimization aims to move VMs to a smaller set of servers, while a network-side optimization tries to identify a smaller set of devices that are sufficient to handle current traffic flow. It is not sufficient to handle each optimization independently, as the placement of VMs may affect the routing decisions.
In the work proposed by Jin et al. [Jin13], the host-side and network-side optimizations are combined together. The experiment result shows that comparing to the unoptimized version, the proposed optimization scheme can save 40% of power consumption when system-wide load is 30%.
The key idea of the host-network joint optimization is based on the observation that the way a VM chooses which server to migrate to is similar to the way a server chooses which switch to send traffic to. Therefore, when planning the routing paths, we can extract VMs from their current hosts and add to those VMs links to the servers that they may migrate to. Later, if a server is on an optimized path that connects a VM, the VM can migrate to that server. The procedure is illustrated in Figure 7 (start from the left figure, towards bottom, and end up at the right).
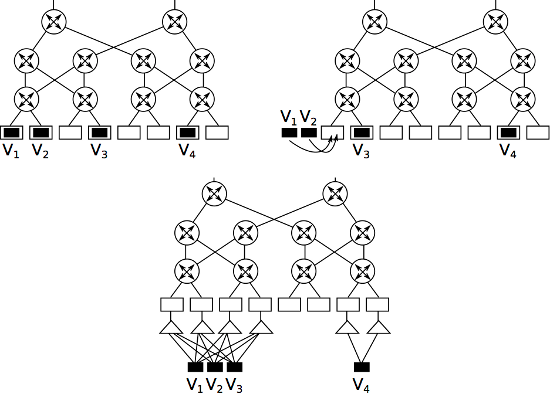
Figure 7: An example of host-network joint optimization.
The above optimization can be modeled as a linear programming problem. Let G = (S+X,L) be the directed graph corresponding to a data center network, where S is the set of servers, X the set of switches, L the set of links. Then we want to minimize the following
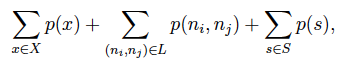
where p(*) represents the power consumption of device *. The optimization begins by dividing the network into several clusters, where each cluster includes servers and VMs within the same subnet. Each cluster then independently performs intra-cluster processing to determine the placement of VMs, and then the inter-cluster processing is performed to create the routing paths. Because each VM migration consumes energy, and the amount of consumption is in proportional to the size of memory it takes, the optimization will try to first move the VMs with less memory requirement. Finally, because each server has finite memory capacity, in between each server and VMs we add a memory constraint, shown in Figure 7 as a triangle dummy node.
In this report, we introduce recent research issues on two aspects of data center networking: data center interconnections and energy efficiency. In conventional, nonoptical DCNs, we present C-Cell, a recursive architecture that uses less numbers of switches than does FatTree. C-Cell has good scalability in both construction and maintenance. Then we introduce optical networking devices and an optical switch architecture that uses them. With optical devices, it is possible to adjust the interconnections on-the-fly to meet different demands on bandwidth. Regarding the energy efficiency issues, we first report a research work that compares the energy consumption of four DCNs. The result shows that FatTree is least energy-efficient if there is no energy conservation scheme involved. But if we apply energy-aware routing or we power off idle devices in four DCNs, then their performances on energy efficiency are dependent on network load. Finally, we present a research work that tries to optimize total energy consumption in DCNs. The proposed protocol centralizes VM placements and aggregates routing paths, leaving more devices in idle state. Then we can power off these devices and save energy.
Note: The references are ordered by relevance.
[Jin13]. Hao Jin et al. "Joint Host-Network Optimization for Energy-ENcient Data Center Networking". IEEE IPDPS, Boston, MA (2013). (link).
[Lin12]. Dong Lin et al. "FlatNet: Towards a flatter data center network". Global Communications Conference (GLOBECOM), IEEE. 2012, pp. 2499-2504. (link).
[Cai13]. Hui Cai et al. "C-Cell: An ENcient and Scalable Network Structure for Data Centers". Journal of Software 8.10 (2013), pp. 2612-2619. (link).
[Che12]. Kai Chen et al. "OSA: An optical switching architecture for data center networks with unprecedented exibility". IEEE/ACM Transactions on Networking (2012). (link).
[Sha12]. Yunfei Shang et al. "A Comparison Study of Energy Proportionality of Data Center Network Architectures". Distributed Computing Systems Workshops (ICDCSW), 2012 32nd International Conference on. IEEE. 2012, pp. 1-7. (link).
[IBM13]. IBM. "IBM and Cisco: Together for a World Class Data Center". 2013. (link).
[Sha10]. Yunfei Shang et al. "Energy-aware routing in data center network". Proceedings of the first ACM SIGCOMM workshop on Green networking". ACM. 2010, pp. 1-8. (link).
[Vah12]. Amin Vahdat. "Delivering Scale Out Data Center Networking with Optics-Why and How". Optical Fiber Communication Conference. Optical Society of America. 2012. (link).
[Che13]. Min Chen et al. "Enabling technologies for future data center networking: a primer". Network, IEEE 27.4 (2013), pp. 8-15. (link).
[Gre09] Albert Greenberg et al. "VL2: a scalable and exible data center network". ACM SIGCOMM Computer Communication Review. Vol. 39. 4. ACM. 2009, pp. 51-62. (link).
[Guo08]. Chuanxiong Guo et al. "Dcell: a scalable and fault-tolerant network structure for data centers". ACM SIGCOMM Computer Communication Review. Vol. 38. 4. ACM. 2008, pp. 75-86. (link).
[Guo09]. Chuanxiong Guo et al. "BCube: a high performance, server-centric network architecture for modular data centers". ACM SIGCOMM Computer Communication Review. 39.4 (2009), pp. 63-74. (link).
[NM09]. Radhika Niranjan Mysore et al. "PortLand: a scalable fault-tolerant layer 2 data center network fabric". ACM SIGCOMM Computer Communication Review. Vol. 39. 4. ACM. 2009, pp. 39-50. (link).
[AF08]. Mohammad Al-Fares et al. "A scalable, commodity data center network architecture". ACM SIGCOMM Computer Communication Review. Vol. 38. 4. ACM. 2008, pp. 63-74. (link).
| DCN | Data Center Network |
| HPR | High-Performance Routing |
| NIC | Network Interface Card |
| OSM | Optical Switch Matrix |
| ToR | Top-of-Rack |
| VM | Virtual Machine |
| WSS | Wavelength Selective Switch |
| WDM | Wavelength Division Multiplexer/Demultiplexer |