| Xuanfan Wu, (at) go.wustl.edu(A paper written under the guidance of Prof. Raj Jain) |
Download |
Anomaly detection is an important and dynamic research area that has been applied and research in various field. This survey tries to provide a basic and structured overview of the anomaly detection. We list some basic elements which decide the formulation of the problem. As well, this survey discuss the application domain where anomaly detection techniques have been applied and developed. Finally, we also discuss various major anomaly detection techniques and list the advantages and disadvantages of them.
Keywords:Anomaly detection, Outlier Detection
Anomaly detection (also outlier detection)is the identification of items, events or observations which is significantly different from the remaining data. anomalies are also referred to as outliers, deviants or abnormalities in the data mining and statistics literature. In most situations, the data is created by one or more generating processes, which are able to not only represent activity in the system but also observations collected of entities. When the generating process behaves unusually, it create anomalies or outliers. Thus, an anomaly often contains valuable information about abnormal characteristics of the systems and elements that impact the at a generation process
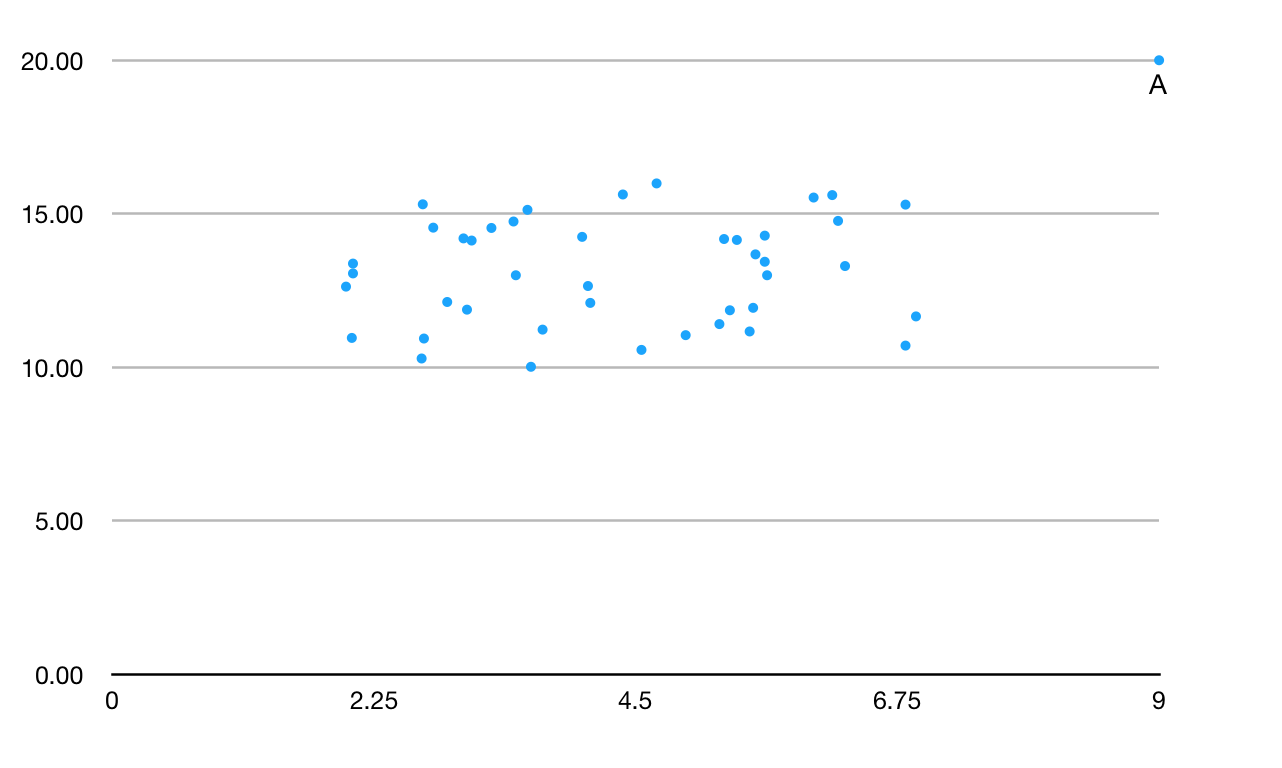
Figure 1: the Data set with Anomaly.
Aggarwal [Aggarwal] regarded that in anomaly detection, "The data model is everything." IN fact, all anomaly detection create a model of the normal patterns in the data and assume the "normal" behavior of the data, and then calculate an outlier score of a given data point through the deviations from these patterns. For example . in Fig. 1, the model may seen the data points in the cluster as the "normal" behavior of a data point, and define the point A as an "anomaly" point.
This survey is organized into three part. In the section 2, we identify different aspects which determine the creation of the problem. In the Section 3, we briefly discuss the variety of application that anomaly detection has been applied into. In the following section, we discuss major anomaly detection techniques including classification based anomaly detection techniques(Section 4), nearest neighbor based anomaly detection techniques (Section 5), clustering based anomaly detection techniques(Section 6), and statistical techniques anomaly detection techniques (Section 7).
This section identifies various aspects of anomaly detection, which brings forth the richness in the problem domain and justifies the need for the broad spectrum of anomaly detection.
A primary part of any anomaly detection is the nature of the input data. The input data can be seen as a set of attributes. The attributes can be of different kinds such as categorical binary or continuous. Each data might has just one attribute or multiple attributes. Furthermore, the attributes of each data stances may be the same or different types.
The nature of attributes determine the applicability of anomaly detection. For example, most statistical models have to be user for continuous and categorical data; for nearness neighbor based models, the nature of attributes would determine how to measure the distance.
Among all these applications, the data has a "normal" model , and anomalies are recognized as deviations from this normal model. The output of anomalies can be spliced into two types:
Anomaly Scores:many anomaly detection algorithms output a score qualifying the level of "outlierness" of each datapoint. this kind of output can contain variety of parameters related to the data point.
Binary labels:binary label indicates whether a data point is an anomaly or not. Despite the fact that some anomaly detection algorithms return binary labels directly, outlier scores can be converted into binary labels. A binary label contains less information than a scoring system. However, it is the final result that is usually needed for decision making.
Most anomaly detection techniques use labels to determine whether the instance is normal or anomalous as final decision. Getting a labeled data which is accurate and representative of all types of behaviors is quite difficult and prohibitively expensive.
Anomaly detection techniques can be divided into three mode bases on the availability to the labels:
Supervised Anomaly Detection: This kind of anomaly detection techniques have the assumption that the training data set with accurate and representative labels for normal instance and anomaly is available. In such cases, usual approach is to develop a predictive model for normal and anomalous classes. Any test data instance is computed in this model and determined which classes it belongs to. However, these technologies have some similar challenges:
Semi-Supervised Anomaly Detection: This kind of technique assume that the train data has labeled instances for just the normal class. Since they do not ask for labels for the anomaly, they are widely applicable than supervised techniques.For example, [Reza] use semi-supervised algorithm to outlier in online social network.
Unsupervised Anomaly Detection:These techniques do not need training data set and thus are most widely used. Unsupervised anomaly detection methods can "pretend"that the entire data set contains the normal class and develop a model of the normal data and regard deviations from then normal model as anomaly.
Many Semi-supervised techniques can be used to operate in an unsupervised mode through operating a sample of the unlabeled data set as training data.[Varun]Such adaptation obeys the assumption that the test data contains a little number of anomalies and the model learnt during training is robust to these few anomalies.
The understating of such unusual characteristics provides useful application-specific insights. Some examples are as follows:
Intrusion Detection Systems: In many computer systems, different types of data are collected about the operating system files, incoming network traffic or other actions. This data may display malicious activity or policy violations. The recognition of such activity is referred to as intrusion detection.
Fraud Detection: fraud detection is a wide-ranging term for theft and fraud committed suing or involving a payment card as a fraudulent source of funds in a transaction. In many cases, unauthorized use of credit card could display different patterns. Such patterns can be used to detect outliers in credit-card transaction data.
Interesting Sensor Events: Sensors are normally used to monitor different environmental and location parameters in many real-world applications. Event detection is one of the primary motivating applications in the field of sensor networks. Sudden changes, regarded as anomaly, in the the underlying patterns could show important events.
Medical Monitoring: Many medical applications collect data from various devices. Unusual data in the collection may display disease conditions.
Eco-system Disturbances Detecting: Many spatiotemporal data about weather changes, climate patterns, or land-cover patterns is collected to support valuable vision about human environmental trends or human activities that may be of interest.
Classification is used to classify a test instance on the basis of the model from a set of labeled data instances whose category membership is known. The operation of classification based anomaly detection techniques is spilt into two steps: 1. The training phase learns a model through the labeled training data set. 2. The testing phase classifies a test data instance as normal or anomaly through the model learnt in the phase 1. [Varun] mentioned that "Classification based anomaly obey a summation that a classifier that can distinguish between normal and anomalous classes can be learnt in the given feature space."
Class based anomaly detection techniques can be divided into two categories : multi-class and one-class anomaly detection techniques on the basis of labels available.
Multi-class classification based anomaly detection techniques assume that the train data set contains labeled instances belonging to multiple normal classes. A data point is regarded as anomaly if it cannot be classifies as normal for any classes.Some multi-class classification design an anomaly score to a test instance. If none of the class are confident in classifying the test instance as normal, the instance is seen as an anomaly.[Figure 2]
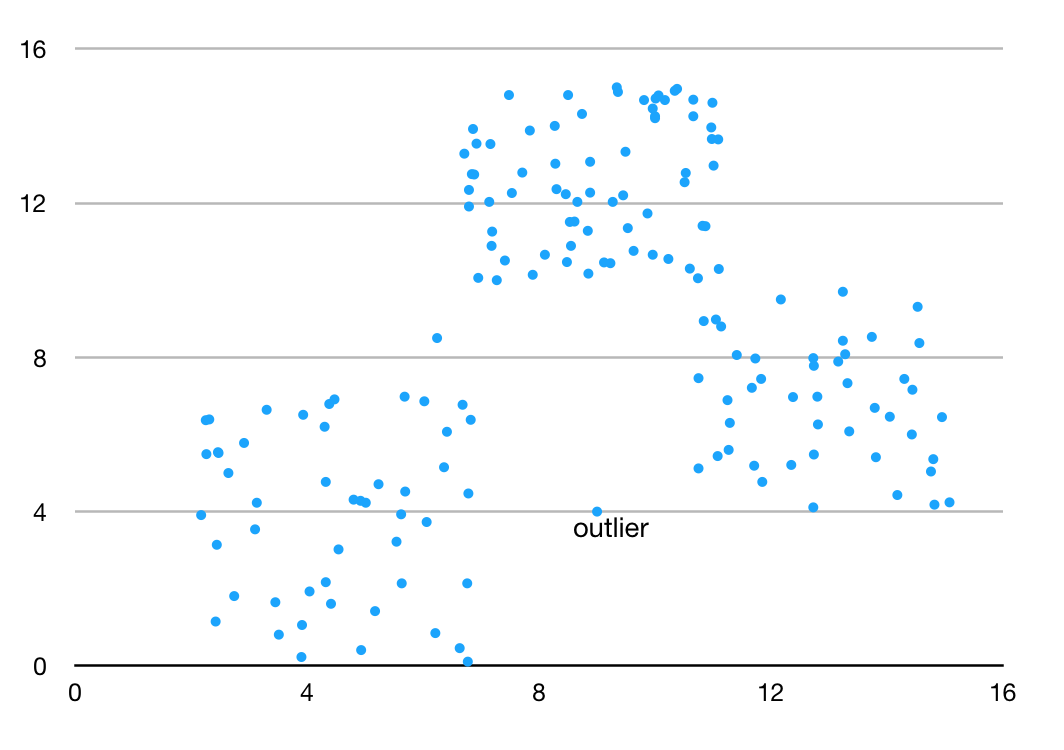
Figure 2: Multi-class Classification Anomaly Detection
One-class classification(OCC) based anomaly detection techniques assume that all training data have only one class label. Such techniques learn a discriminative boundary around the normal instances using a one-class classification algorithm e.g Feature Boundaries Detector for One-Class Classification FBDOCC method[Jun],One-class SVM, Least Squares One-class SVM, Kernel PCA, Gaussian Process Prior OCC, Condensed Nearest Neighbor Data Description and One-class Random Forests. Any test instance that does not fall withes the learnt boundary is regarded as anomaly like Figure 3.
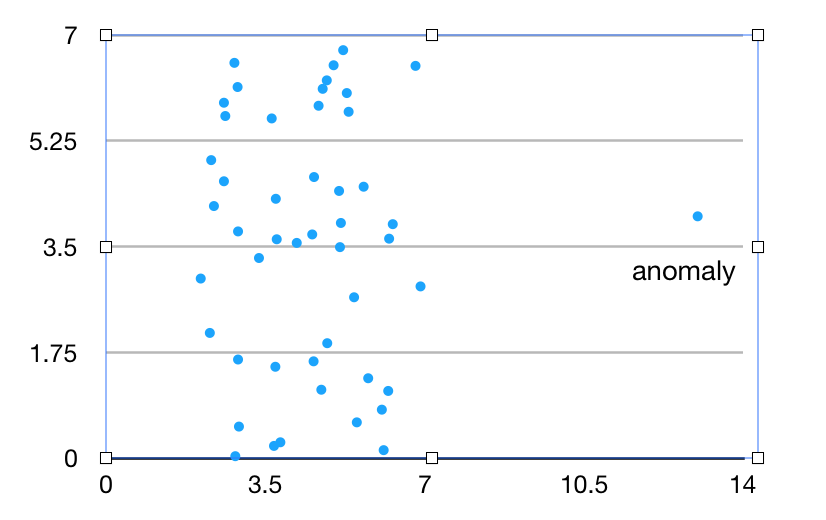
Figure 3. One-class Classification Anomaly Detection
The following is various anomaly classification detection techniques model:
[Varun] Support Vector Machines (SVMs) has been used to anomaly detection in the one-class setting and gain big success. Such techniques use one class learning techniques for SVM and learn a region that includes the training data instances.[5] This technique is improved by Jun Yang[2017] by using restricted boltzmann machine to detect network anomalies.[Shanxiong](2016) present a SVM intrusion detection model based on compressive sampling which can realize detection of network anomaly behavior quickly without reducing the classification accuracy.
Bayesian networks has been applied for anomaly detection in the multi-class setting. Bayesian network estimates the posterior probability of observing a class label from a set of normal class labs and the anomaly class label, given a test data instance. The class label with the biggest posterior is regarded as predicted class for the given test instance.
For example, [Jiangguo](2015) developed a novel multi-classification intrusion detection model using Bayesian framework which reduces the dimensionality of the feature vectors to enable better analysis of the data resulting in higher detection rate and better computational efficiency.
The advantage of classification based techniques are as follows:
The advantage of classification based techniques are as follows:
The disadvantage of classification based techniques are as follows:
The concept of nearest anomaly detection techniques are based on the following assumption:
Normal data instances locate in dense neighborhoods, while anomalies lie far from their closest neighbors.
Nearest neighbor based anomaly detection techniques need a distance or similarity measure to define the difference between two data instance. Distance between two data instances can be computed in different ways.Euclidean distance is a common measure to continuous attributes which simple matching coefficient is usually used to categorical attributes. For multivariate data instances, distance or similarity is usually computed for each attributes and then combined.
Nearest neighbor based anomaly detection techniques could be divided into two categories:
The basic definition of this kind of nearest neighbor anomaly detection techniques is that : The anomaly score of a data instance is defined as its distance to its kth nearest neighbor in a given data set. For example,[Liwei] proposes a novel network anomaly detection method based on transductive Confidence Machines for K-Nearest Neighbors which can detect anomalies with high true positive rate, low false positive rate and high confidence than the state-of-the-art anomaly detection methods. Furthermore, the method can keep robust and effective with the noisy data.
For a given data instance, the distance to its kth nearest neighbor equals to the radius of a hyper-sphere, centered at the given data point, which includes k other instances. Therefore, the distance to he kth nearest neighbor for a given data sentence can be considered as an estimate of the inverse of the density of the instance in the data set.
Density based anomaly detection techniques estimate the density of the neighborhood of each data instance. An instance that located in a low density area is regarded as anomaly which an instance that lies in a dense area is regarded as normal.
The advantages of nearest neighbor based techniques are as follows:
The disadvantages of nearest neighbor based techniques are as follows:
Clustering is used to group similar data instances into clusters. Clustering is usually an unsupervised technique. Clustering based anomaly detection techniques could be spliced into two kinds.
The first kind of Clustering based techniques rely on the following assumption:
Normal data lies in a cluster while anomalies do not belong to any cluster.
For example, [Alejandro] progreso a clustering-based anomaly detection method for multi-view data which is simple and effective. This method find anomalies by comparing the neighborhoods in different views. Then, clustering is performed respectively in different views and affinity vectors are derived for each object from the clustering result. Finally, the anomalies are found out by comparing affinity vectors in the multiple views.
The second kind of clustering based techniques depend on the following assumption:
Normal data instances belongs to big and dense cluster, while anomalies either belong to little clusters.
Techniques base on the above assumption mentions that instances in small size cluster are anomalies.
The advantages of clustering based anomaly detection techniques are as follows:
The disadvantages of clustering based anomaly detection techniques are as follows:
The key principle of any statistical anomaly detection techniques is : "An anomaly is an observation which is suspected of being partially or wholly irrelevant because it is not generate by the stochastic model assumed". Statistical anomaly detection techniques have the following basic assumption:
Normal data instances locate at high probability area of a stochastic model, while anomalies have a low probability.
Both parametric and non-parametric techniques have been used to develop statistical anomaly detection models. Parametric techniques assume knowledge of the underlying distribution and estimate the parameters from the given data while non-parametric do not.
Parametric techniques assume that the normal data is created by parameters and the anomaly score of a data instance is the probability density function related to the parameters.
Base on the type of distribution assumed, parametric techniques can be further categorized as follows:
Gaussian Model Based:Such techniques assume that the parameters are Guassian distributed. In this kind of techniques, parameters are estimated through Maximum likelihood estimated(MLE). The deviation is applied to the anomaly scores to classify the anomalies.
Regression Model Based:Anomaly detection using regression has been applied to many aspect[1] such as Linear Regression Models, High-dimensional outlier Detection, categorical or mixed data and time series data.
The basic regression model based anomaly detection technique includes two steps. The first phase is that a regression model is learnt using the data. In the second step, the residual, the part not explained by the regression model, for each test instance is used to determine the anomaly score. With certain confidence, the amount of the residual can be used as the anomaly score for the test data.
This type of anomaly detection techniques use non-parametric statistical models. Therefore, the model structure is not defined a prior, but from given data. These techniques make fewer assumptions regarding the data, such as smoothness of density.
Histogram Based: These techniques use histograms to keep a profile of the normal data. Histogram based techniques are also considered as frequency based or counting based.
[Markus]Markus Goldsein and Andreas Bengel proposed histogram based outlier detection (HBOS) algorithm, which assumes independence of the features making it much faster than multivariate anomaly detection approaches. It points out that the histogram is required if the results of outlier detection are available immediately and data set are very large like in Network Security domain.
The advantages of statistical techniques are:
The disadvantages of statistical techniques are:
In this survey, we have discuss different way in which the problem of anomaly detection has been formulated in literature, and attempt to offer an overview of the huge literature on various techniques. For each type of anomaly detection techniques, we discuss the key assumption, typical method and the advantage and disadvantage, which can be the guideline to know about anomaly detection to further degree.