| Tara Salman, tara (dot) salman (at) wustl.edu (A paper written under the guidance of Prof. Raj Jain) |
Download |
With the current distributed applications need, the use of a single cloud is not enough and organizations have already moved to the use of multi-clouds. To make efficient use of multi-cloud, a management platform that manage and control resources over multiple clouds is needed. Security, is a major concern in such platforms and efficient security mechanisms are necessary for the good use of such platforms. In our labs, a multi-cloud management platform was deployed. Security, using traditional cryptographic techniques, was added as a service that our platform offers.
In this work, we analyze the performance of the system under different system and security parameters. Such parameters include key size, number of clients, number of requests each client make and the crypto-algorithm used in encryption/signature. Different performance parameters are considered and full factorial design is used for analyzing our experiment. Results showed that those metrics were good for setting up the communication, however, not as good when the request/response comes. More convenient factors are expected to be taken in the future.
Multi-cloud computing, security, OpenADN, public key cryptography, symmetric key cryptography, AES algorithm, RSA algorithm, performance analysis, full factorial design.
With the current vast amount of storage and computational needs, enterprises, organizations and individuals are adopting virtual resources from multiple cloud providers rather than hosting them physically. Such adaptation provides a cost effective, reliable, fast and scalable solutions that can be geographically distributed to be closer in proximity to the end-users. This introduced a new networking paradigm that is referred to as a multi-cloud environment. Thus, in a multi-cloud environment, multiple cloud providers, application providers, and network service providers collaborate to offer multiple services to end users. Multi-cloud environments require to have a specialized platform that manages data distribution among cloud providers. In our labs, we have deployed a multi-cloud management platform that is referred to as Open Application Delivery Networking, or simply OpenADN [PAU13].
One new feature that was added to OpenADN is security where each message communicated between entities in the system is encrypted. Further, messages between clients and the application could be signed based on client requests. We utilize classical cryptographic techniques to implement that. In specific, message between server components are encrypted using use Advanced Encryption Standard (AES), [AES_wi], assuming a pre-shared key. The first message between clients and server always utilize Rivest-Shamir-Adleman (RSA) public key cryptography, [RSA_wi], to initiate the communication and agree on a shared cryptographic algorithm. Clients may use RSA or AES encryption for further messages communicated by the system. The advantage of RSA over AES is the signature feature added which eventually provide non- repudiation that are desirable for some clients. However, RSA is known to be more complex and take more time than AES encryption.
In this study, we use performance evaluation techniques to evaluate the two traditional security mechanisms, RSA and AES, in OpenADN. Specifically, we analyze the time required doing many new tasks added with security. We utilize full factorial designs in our analysis. Two stages are evaluated: setup phase and request/ response phase. The setup phase includes the initial communication between client and server to agree on a common methodology to use for cryptography and share public keys. The request/response phase includes the requests from the client and the response from servers, both encrypted and signed in the case of RSA. Factors in the experiment included both system and security parameters, including: the crypto-method used for communication, key length, number of clients, and number of request per client. Our performance metrics include: time for key generation, encryption, decryption, signature, and validation. In addition, the response time (RT) is to be evaluated by three measures: time between client sending request and the server receiving it, time between clients request and server finishing processing it, and time between clients request and response. We emphasize on the techniques learned in the class to measure each metric that we evaluate.
Results showed that the chosen factors were good, generally, for the setup phase where the initial key setup take place. Meanwhile, they were not perfect for the request/response phase. This is due to the fact that the setup phase depends on security matric as it includes key generation and agreement. These two metrics are expected to dominate the performance; thus, our factors should have a large effect. On the other hand, for the request/response phase, security has the minimal effect in signature/verification and encryption/decryption. These metrics take less times than network and CPU processing and thus expected to have less effect. Thus, the factors chosen should have a larger effect on the setup phase which will be confirmed later in our results section.
The rest of the paper is organized as follows: section 2 gives a brief background about our work and discuss some of the related works. Section 3 discusses the implementation of OpenADN and how security was incorporated. Section 4 highlights the experimental design consideration, including metrics, parameters, factors and design setup. Section 5 presents our experimental results along with the discussion and analysis. Finally, section 6 concludes our discussion and discuss the main outcomes.
In this section, we give a brief background on OpenADN, its architecture, and RSA and AES encryption algorithms. In addition, we highlight some of the recent work related to this project.
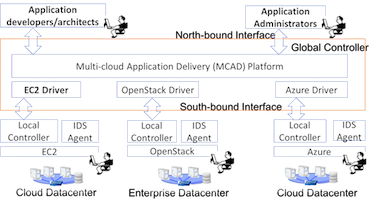
OpenADN is designed to support deploying multi-cloud applications, thus, its architecture should interface two systems: public clouds and enterprise infrastructure. In other words, it intervenes the two parties so that enterprises do not need to manage resources distribution by their own. This description of OpenADN is illustrated in Figure 1. As can be seen, the northbound is the interface that connects the system to application developer, architects, and administrators. It allows administrators to manage their application needs and policies. On the other side, the south bound connects the platform to the public clouds through drivers. Currently, Openstack driver is deployed as it is the available free cloud provider, however, others can be added when needed. This project is concerned with the north bound only as we are concerned with clients connected to applications rather than cloud infrastructure. The application that is deployed currently in OpenADN is an HTTP application, just for simplicity, where clients send HTTP requests and the system replies with an HTTP response. We also refer to that as multi-cloud application delivery (MCAD), [PAU13b].
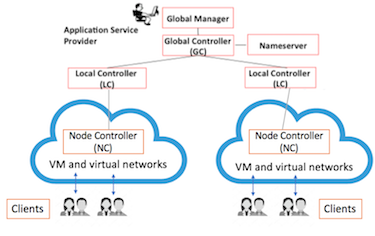
To implement the architecture discussed above, OpenADN needs to be composed of many components: Global Controller (GC), Local Controllers (LC), an application or Node Controllers (NC) and clients. The components and their connectivity are illustrated in Figure 2. As can be seen, GC is the basic MCAD component that manages the whole system. LCs interface public clouds with GCs, NCs are in clouds to manage applications within that cloud, and clients are simply application users. A GC initiates LCs on multiple clouds and control the load and distribution of resources on these clouds. The LC controls the NCs in a single cloud by tracking and managing consumed resources in that specific cloud. The NC initiates application services in agreement with the GC and serves multiple clients that interested in offered services [PAU12].
In addition to enterprises, organizations and individuals, massively distributed today and future applications can benefit from OpenADN architecture. For example, healthcare and mobile applications require their data to be globally distributed and mostly managed by other entities due to the lack of resources locally at one server. OpenADN can manage globally distributed applications and offer low latency for real-time applications. Moreover, three new trending applications can strength the usefulness of OpenADN: micro-clouds, mobile edge computing and internet of things. Micro clouds are small clouds that can be a computer, or a small server. Mobile edge computing locates micro-clouds at internet service providers and cellular network towers to offer services that are fast in processing and closer in proximity to users. Both trends are expected to be incorporated with 5G networks by 2020. On the other hand, internet of things applications can also benefit from OpenADN distributed architecture and micro-clouds. Thus, OpenADN seems to have potential benefits for many of today and future applications [PAU12, PAU14, PAU13, PAU13b].
Security in such platforms is a major concern. The platform needs to guarantee availability, confidentiality, integrity and non-repudiation. In the following, we briefly explain each of those requirements and highlight how OpenADN can meet them:
In this section, we discussed our multi-cloud management platform, OpenADN. We presented the architecture, the main components and the security services provided by the platform. This will help readers understand the use of the system which we are targeting to secure and analyze in the rest of the discussion.
RSA and AES are the most famous and currently used public key cryptography and symmetric key cryptography. Thus, they were implemented as part of OpenADN security. This section will briefly discuss both of those algorithms and we refer the readers to [RSA_wi, AES_wi] for further reading.
Rivest-Shamir-Adleman (RSA) is the first practical public key cryptography that is widely used in many of today's systems. The algorithm generates two keys: public and private. As the name indicates, the public key is kept private while the private key is secret. Encrypting the data with one key insures that the decryption cannot be made except if you have the other key. Thus, when posting your data to the cloud, the encryption should be done with your public key so that the decryption can be done only by you using your private key. Similarly, when sending data to others, encrypt with the other public key so that only they can decrypt it. The algorithm also has the ability to sign/verify data and thus guarantee integrity and non-repudiation. As in encryption/decryption, one key is used for signature while the other is used for validation but not both. The signature is done by the owner or the sender private key so that everyone can verify the data correctness and ownership but no one can sign the data. The details of how the keys are generated and the math behind them is out of the scope of this paper, however, interested readers can refer to [RSA_wi] for further readings.
Advance encryption standard (AES) is a symmetric key encryption standard that is standardized by NIST in 2001. It allows two parties to encrypt their messages and communication using a shared secret key. Generally, this shared key is agreed either using a private communication channel or using RSA algorithm. The encryption and decryption can be done by the same key, thus, both parties should have the same key and no one else can know it. Unlike RSA, AES does not provide signature validation features, hence, does not insure integrity and non-repudiation. The details and the math behind the algorithm is out of the scope of this paper, however, interested readers can refer to [ AES_wi] for further readings.
This section briefly discussed AES and RSA crypto-algorithms. Table I summarize the difference between RSA and AES [KHA14]. The basic tradeoff to make here is between complexity/delay and the required security services. Thus, OpenADN implement both and we leave it to the developer and client to decide on the algorithm they want.
| Feature | RSA | AES |
|---|---|---|
| Number of keys | Two | One |
| Cryptosystem | Public-key (asymmetric key) | Symmetric key |
| Complexity | Relatively high | Simple |
| Offers integrity and non-repudiation? | Yes | No |
| Key exchange | Does not need as public keys are made public | Need a key exchange |
The research works related to this project can be divided into two: performance analysis of OpenADN and performance analysis of the cryptosystems used. For OpenADN performance analysis, the work in [GUP16] studies the possibility of finding high resources demand tasks in the platform. In other words, it examines whether some tasks of GC, LC, or NC consume lots of system resources or no. The work profile such tasks and tries to find factors and parameters that mostly affect the system. Note that in the prior work, the platform was not having security features and thus this work will differ from what was done in profiling the system. In addition, their analysis was system-wise while our analysis is both a system and network wise.
Several works exist to analyze the performance of cryptosystems. For example, the work in [FAR12] analyzed the performance of RSA and two other asymmetric key algorithms in terms of encryption time, decryption time, memory usage and throughput. Such analysis was done with different key size and text length. Their results showed that RSA was the best in terms of low delay and higher throughput. However, the performance of the signature and validation was not taken into consideration. The work in [PRA14] included both symmetric and asymmetric cryptosystem analysis and was done in terms of encryption/decryption time and memory usage. In [SIN16] the authors analyzed the performance of RSA and Elliptic Curve Cryptography in terms of time, security, and memory as well. The work in [ALI15] evaluated RSA and other digital signature schemes in named data networking networks. More importantly, the works in [KHA15, BOK17] analyzed time, memory and throughput of RSA algorithm in cloud computing. Their work focus on one cloud environment and measures the metrics for key generations and encryption/decryption. Our work can be differentiated from others in two ways: application to multi-cloud management platform and analysis used. Up to the author's knowledge, this is the first work that analyzed security in management platforms like OpenADN. In addition, it differs from others using the sophisticated performance analysis methods learned in class. Most other works only considered one factor designs while this work will be using full factorial design in the analysis as will be seen later.
This section gave a brief background about OpenADN and the crypto-algorithms used in OpenADN. This should highlight the importance of OpenADN and its criticality in future applications. In addition, it differentiated between different security services offered by OpenADN using the traditional cryptographic algorithms. Finally, the discussion included recent research work related to this work and the work can advance other works already done in evaluating cryptosystems.
This section briefly discusses how OpenADN was implemented and how RSA/AES were incorporated. We introduce our two phases of the project and further highlight how RSA/AES is used in phases.
OpenADN is complex by the nature of distribution. Different components need to communicate in different ways and thus it is critical to understand how the platform work and how the security can be incorporated.
Due to its complex architecture and component interactions, OpenADN was divided to two planes: control and data plane. Control plane communicates control and management messages between entities, for example, load notification from LC to GC or application policy change from NC to GC. Data plane communicates the actual queries from clients which are HTTP requests/response in our case and they are done between NCs and clients only. The code for control plan was done in Python while the code for data plane is a mix of Python and C codes. The overall code is more than 10,000 lines and that is separated between different modules. To provide concurrency of running and fast replies, multi-threading was used all over OpenADN. Thus, the architecture is complex by the nature of distribution and many decisions and optimizations needed to be made for efficient implementation of the platform.
To secure OpenADN, both control and data planes need to be secured and that was done by traditional crypto-algorithms. On the control plane, AES was used to encrypt the data without signature features. The reason for that is simplicity and the fact that components of the control plane are assumed to have secure channel communication. Those components are GC, LC and NC which can do the key exchange offline when they agree on the application. Further modification to the project can add more sophisticated cryptosystem between these components, however, for the current implementation, AES is enough. On the other hand, the data plane is application developers and clients' choices. Thus, both AES and RSA are implemented to secure this plan and it is up to the developer or user to use one of them. The code of the implementation was done in Python as well using PyCrypto package, [PYCRY].
Due to its complex architecture and communication needs, OpenADN developers divided the system into control and data planes. Both planes were secured as part of OpenADN security with AES and RSA. The next section divides the data plane security into phases and discuss the details in implementing each phase.
This project targets only the data plane analysis as it consumes most of the computation and communication resources within OpenADN. This plane includes the setup and request/response phases between the clients and NCs. The first message between the two always uses RSA to decide on the crypto-algorithm and the key used. This is what we refer to as setup phase. Further messages are done at the request/response phase and the security is based on clients' needs and choice of the crypto-algorithm. It is assumed that the control plane is already set up at this phase and GC knows the public keys of the NCs associated with different applications.
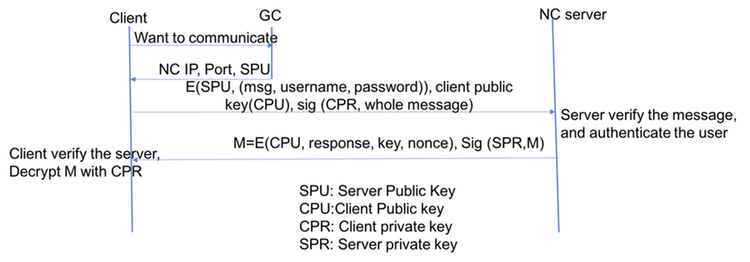
In the setup phase, NCs and the client need to agree of crypto-algorithm and share their keys. Thus, several steps are included in this phase and that is illustrated in Figure 3. As can been, the client first communicates with the GC to get the NC information. This information includes the IP, port, and the public key which we refer to as server public key (SPU). Then the client generates its own public/private key and tries to initialize the communication with the NC server. The first message from the client side consist of its username, password, and initialization message. This message is encrypted with the server public key so only the targeted server can decrypt it with its private key. In addition, client public key (CPU) is sent in public and the whole message is signed with the client private key (CPR) so that everyone can verify the message but no one can sign it again. Further the signature also adds to the security of the message as no one can sign the same message except the owner of the private key. The server verifies that the message is correct and authenticate the user. If this pass correct, then a reply message is generated to finalize the setup phase. Similarly, the reply message is encrypted with CPU so that only the clients can decrypt it. The message includes the response and a key and a nonce. These variables initiate the secret keys between the server and client in case the client decided to go with AES. Further, the server sign the message with its private key, server private key (SPR), so that it can be verified the client and no party can deny that the communication has been initiated. By this the setup phase is done and both parties can move to the actual request/response phase.
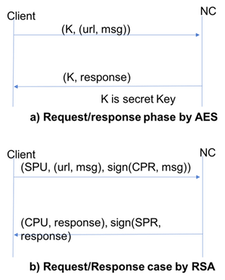
In the second phase, the communication between client and server is already initiated and so the requests start from the client sides and NC replies with its response. As said before, the requests in this project are in terms of HTTP requests/responses. Figure 4 illustrates the phase in both AES and RSA cases. If the client chose to go with AES, then he simply encrypts the message with the secret key. The secret key can be generated from the key and nonce received in the previous stage. In case of RSA, the client encrypts the message along with the url with SPU and sign with its CPR. The reply is encrypted with CPU and signed with SPR. As can be seen, both cases provide confidentiality, however, integrity is provided only in RSA case.
As a result, security is provided in both phases and the evaluation of such schemes is to be done in the next section. Note that those two phases were separated as they involve two different procedures and requirements of both clients and server parts. Further research is to be done investigating the optimization of those two stages so that the security is provided with minimal communication overhead.
This section discussed OpenADN implementation and how the security features were incorporated. Further, we discussed the two phases that are to be evaluated in the next section. Note that this is only evaluating the data plane while the control plane is left as a future work. Also, the mechanisms discussed do not consider mitigation of the server and the need for clients to connect to other servers. This is to be investigated as well as part of our future work.
In this section, we discuss our performance metrics, factors, and their levels. Further, we highlight our experimental design and data collection phase collected so that next section would include only our results and analysis.
Different system and security performance metrics can be chosen to evaluate the added security features. The chosen metrics and their description is summarized in Table II. All those parameters are time based and they will be measured in seconds. The critical ones include: key generation time and RTs as they will be dominating the overall time in the setup and request/response phases, respectively. However, we will be measuring others to check the effect of our factors on all security metrics.
| Metric (s) | Type | Phase | Description |
|---|---|---|---|
| Key generation | Security | Setup | Time taken to generate public/private key in the first phase |
| Encrypt message | Security | Setup | Time taken to encrypt the first message sent from client to serve |
| Sign message | Security | Setup | Time taken to sign the first message |
| Response time 1 (RT1) | System | Both | Time between the client sending the request and the server receiving it |
| Response time 2 (RT2) | System | Both | Time between the client sending the request and the server finishing the response |
| Response time 3 (RT3) | System | Both | Time between the client sending the request and receiving the response at the client |
| Decrypt message | Security | Setup | Time taken to decrypt the first response from the server on the client side |
| Decrypt and reconstruct key | Security | Setup | Time taken to decrypt the message and reconstruct the secret key sent by the server |
| Signature verification | Security | Setup | Time to verify the response message |
| Overall Time | System | Both | The time taken from initiating the message at the client time till finishing response processing |
As can be seen from the table, some metrics were only involved in the setup phase rather than both phases. The reason for that is either because the metrics are constants in the second phase or it is not even involved. For example, encryption time, decryption, signature, and validation are expected to be almost constant when the second phase is conducted. This will be clear when we discuss factors and their level in the next subsection. Further, key generation and secret key reconstruction are only done in the setup phase and thus cannot be measured in the other phase. RTs are evaluated in both cases, since they are systematic and they depend on the workload which varies in all cases.
Thus, 10 performance metrics will be chosen to evaluate the performance of the setup phase while only four will be chosen at the request/response phase. All parameters are time based and measured in seconds as this would be the only metric chosen for now. Throughput, memory use and overhead can be added as part of the future work of this project.
Different factors and parameters can affect the security and system performance measured in this project. These include the number of computers, key size, message length, number of users and many others. These are summarized in Table III with their constant or changeable levels. Note that our fixed parameters were fixed due to time limitation and the fact that we cannot change them much. For example, the number of computers was set to 1 and the whole security features are added to one computer and expected to be added to others soon. The network and computer system load is unchangeable and thus were set to defaults. The message length will depend on many embedded factors, thus, was set to fixed length message to simplify the measurement procedures.
| Parameter | Effective phase | System or workload |
|---|---|---|
| Number of computers | Both but fixed in our experiments | System |
| Key length | Setup phase mostly | System |
| Message length | Both but unchanged in our experiments | Workload |
| Number of clients | Both | Workload |
| Number of requests per client | Request/response | Workload |
| Crypto-algorithm | Request/response | System |
| Memory available | Both but fixed in our experiments | System |
| CPU capabilities | Both but fixed in our experiments | System |
Our factors and their ranges are presented in Table IV. Note that we chose those levels carefully after doing some experiments that were eliminated from this report. For example, a server in OpenADN is loaded when 5 clients connect simultaneously to it. This was done by the designer of OpenADN. Further, key size of 1024 is small as it is the NIST smallest key to be used. 512-bit key was used before, but was proven to be unsecure, thus most systems don't use it now. 2048- bit is the considered large as the time taken to generate key is considerably larger than 1024-bit key. Further key lengths were tested, but proven that the time required for them is too long to be done on a single machine. Thus, 2048-bit was chosen.
| Factor | Phase | Levels |
|---|---|---|
| Key length | Setup phase | Small (1024bits), Large (2048 bits) |
| Number of clients | Both | Non-load (1 client), Load (5 clients) |
| Number of requests per client | Request/response phase | Non-load (1 request), Load (vary) |
| Crypto-algorithm | Request/response phase | RSA/AES |
The design of those factors, levels and phases were chosen carefully. For example, the key length can only affect the setup phase in key generation, however, not effective in the overall time of the request/response phase. The crypto-algorithm is fixed in the setup phase, as was discussed, we only vary it in case of request/ response phase. The same thing is applied to the number of requests because only one request is required in setup phase. Number of clients can vary in both and was chosen to be a common factor between the two.
A full factorial design will be used in the evaluation of both phases. Measurement will be chosen as evaluation method and the workload is to be given by running the platform with different clients/requests. Each experiment was run for 150 repetitions. The first phase included two controllable factors, each with two levels and thus four experiments are to be done. In each experiment, 10 metrics are to be collected and evaluated by full factorial design analysis. For the second phase, we have three controllable factors with two levels each. Thus, eight experiments are to be done and four metrics are to be collected. Similarly, these metrics will be evaluated by the full factorial design analysis. Data were collected using system time given by python, which guards each of the required parameter codes. The start will have a timer which finishes at the end and the difference was calculated and reported to excel sheet. Then further analysis was done from the excel sheet.
In this section, we discussed our performance metrics, parameters, factors, level and experimental design methodology. This section is to be referred to in the following section which will present the results of experiments and analyze them.
This following 2 sections present the results of the experimental design done in the previous section. We focus this section of the setup phase while next section will focus of the request/response phase. We analyze the data in terms on main response, confidence intervals, percentage variation, error vs predicted response plots, and Q-Q-plots. Since we are dealing with processing time and response times, all the analysis will be done using a log transformation rather than linear analysis.
As discussed, four experiments are done in the setup phase and 10 metrics are to be analyzed. Table V shows the overall average results for the 10 metrics and the following sections will discuss their analysis in details. Note that for these experiments, factor A is the key size while factor B is the number of clients.
| I | A | B | AB | Key Generation | Encryption Time | Decrypt Reconstruct Key | Decrypt message time | Signature Time | Signature verification | RT1 | RT2 | RT3 | Overall time |
|---|---|---|---|---|---|---|---|---|---|---|---|---|---|
| 1 | -1 | -1 | 1 | 2.76 | -1.30 | 1.28 | 1.00 | 0.77 | -0.40 | 0.54 | 1.65 | 1.71 | 2.81 |
| 1 | 1 | -1 | -1 | 3.48 | -1.31 | 1.96 | 1.65 | 1.58 | -0.47 | 0.55 | 1.65 | 1.69 | 3.49 |
| 1 | -1 | 1 | -1 | 3.51 | -1.25 | 1.77 | 1.45 | 0.91 | -0.40 | 1.42 | 1.95 | 2.04 | 3.53 |
| 1 | 1 | 1 | 1 | 4.19 | -1.26 | 2.41 | 2.10 | 1.78 | -0.44 | 1.61 | 2.02 | 2.12 | 4.20 |
In this subsection, we discuss metric related to the key agreement process. This include: Key generation time, encryption time, decryption time, signature time and verification time. We also add the key reconstruction time in this subsection as such metric is also related to the key and cryptography.
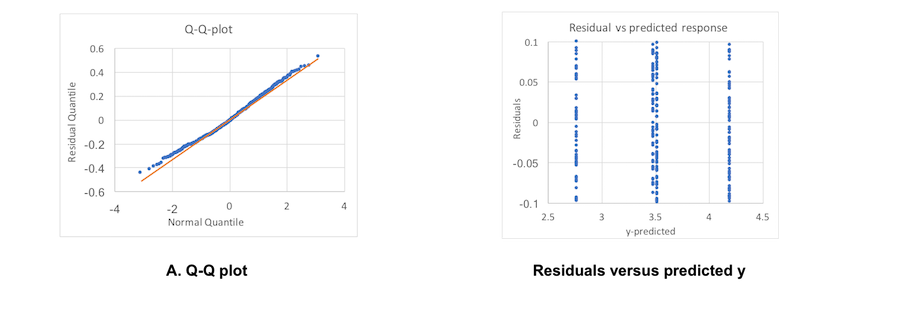
Key generation time is the first to be done at this phase as it is the most time-consuming metric. The average time taken when one user and small key (first line) was used was about 600 seconds while the average time with 5 users and long keys (last line) was about 17,000 second. Thus, the max/min value is too large and log transformation is confirmed. The effect of each parameter along with confidence intervals and percentage variation is shown in Table VI.
| Factor | Main effect | % variation explained | CI | Significant? | Important? |
|---|---|---|---|---|---|
| A | 0.35 | 42.84 | (0.33, 0.36) | Yes | Yes |
| B | 0.37 | 47.30 | (0.35,0.38) | Yes | Yes |
| AB | -0.01 | 0.03 | (-0.02, 0.001) | No | No |
| Error | 9.80 | No |
As can be seen, the error was less than 10% with 90 percent confidence interval. Both A and B were significant and important and they explained a lot of the model. Interaction was non-significant and non-important which indicates that the two factors does not interact. The expectation was that the key size (A) has a higher effect than the number of users (B), but that was not confirmed by the results. The difference was not as big and B had a higher value. This can be due to the concurrent processing by the client module for all clients which lead to the delay being almost similar. With higher key lengths, the effect is much higher.
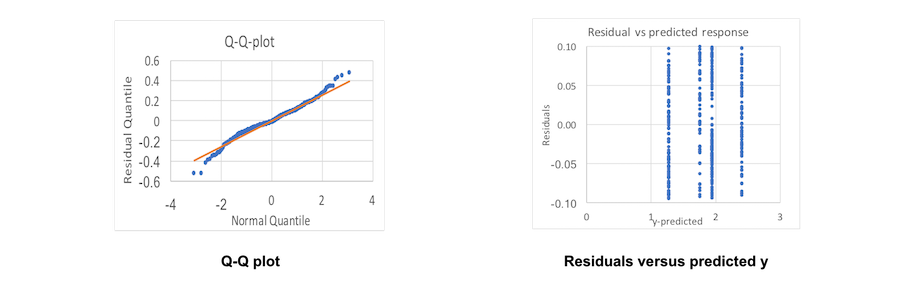
Q-Q plots and the error plots are illustrated in Figure 5. As can be seen both figures pass the visual tests and the model seems to be good in terms of key generation time, as was reflected from the results.
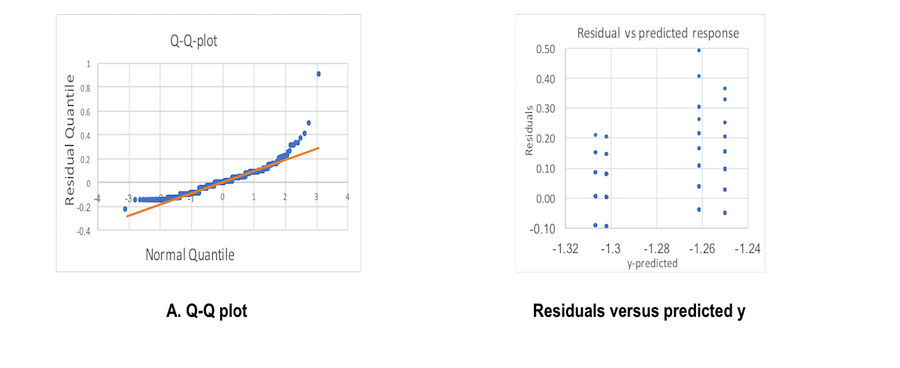
Encryption time is expected to be so small and not affected by both parameters. It should highly depend on the CPU processing power of the computer used which was not considered in these experiments. Log transformation was taken directly and the results of main effects, confidence interval, and percentage variation are shown in Table VII.
| Factor | Main effect | % variation explained | CI | Significant? | Important? |
|---|---|---|---|---|---|
| A | -0.004 | 0.177 | (-0.01, 0.003) | No | No |
| B | 0.024 | 6.652 | (0.17,0.031) | Yes | No |
| AB | -0.002 | 0.029 | (-0.008, 0.005) | No | No |
| Error | 93.142 | Yes |
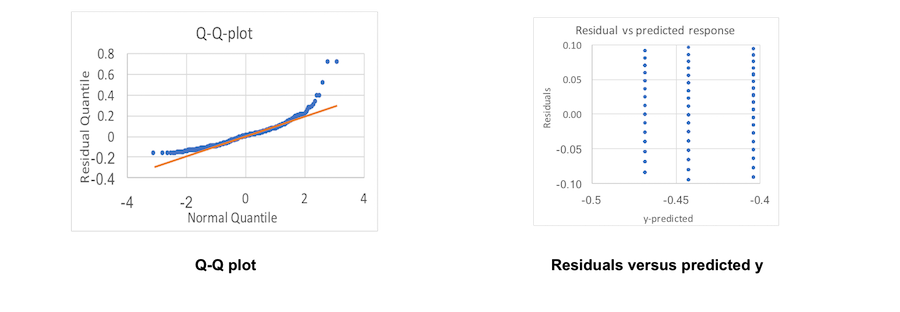
As can be seen from the table, error explains most of the analysis which reflects our discussion above. The error generally comes from CPU capabilities and memory available which could not be measured in the context of this project. Q-Q plot and residuals analysis are illustrated in Figure 6. They reflect the same conclusions made above.
| Factor | Main effect | % variation explained | CI | Significant? | Important? |
|---|---|---|---|---|---|
| A | 0.419 | 88.555 | (0.41, 0.43) | Yes | Yes |
| B | 0.085 | 3.646 | (0.075,0.95) | Yes | No |
| AB | 0.015 | 0.110 | (0.004, 0.025) | Yes | No |
| Error | 7.689 | No |
Q-Q plots and residuals are illustrated in Figure 7. The results match with the discussion above.
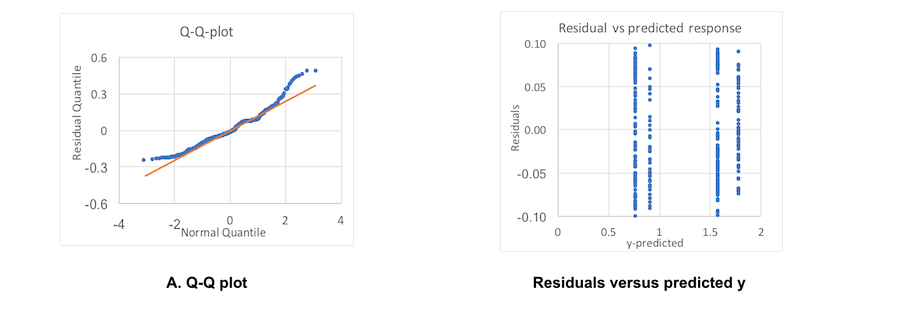
Similarly, the decryption time was done by log transformation. Table IX shows the results of this time analysis. The time is so small and so the expectation of which factor takes most of the effect is not known. However, theoretically the key size should be more important.
| Factor | Main effect | % variation explained | CI | Significant? | Important? |
|---|---|---|---|---|---|
| A | 0.33 | 60.10 | (0.32, 0.34) | Yes | Yes |
| B | 0.23 | 30.49 | (0.22,0.24) | Yes | Yes |
| AB | -0.01 | 0.03 | (-0.02, 0.01) | No | No |
| Error | 9.38 | No |
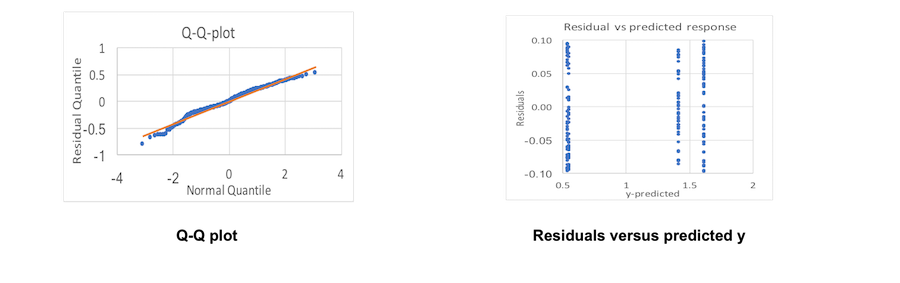
Most of the models were explained by both factors: key size and number of clients. The interaction was both not important and not significant. The errors were less than 10 which is relatively low. Figure 8 shows the visual test for the model.
Another factor to consider is the secret key reconstruction time. This time included two decryptions for the key and the nonce and thus the performance is expected to be similar to decryption time performance. Table X shows the results of this time analysis.
| Factor | Main effect | % variation explained | CI | Significant? | Important? |
|---|---|---|---|---|---|
| A | 0.32 | 58.08 | (0.31, 0.34) | Yes | Yes |
| B | 0.22 | 27.89 | (0.21,0.23) | Yes | Yes |
| AB | 0.001 | 0.00 | (-0.01, 0.01) | No | No |
| Error | 14.03 | No |
As can be seen, the error was higher in this case due to the time taken to reconstruct the key, given both key and nonce. This time was not reflected by any of the factors as they length is not the same for AES. However, it was less than 15% and the main effects when from both factors A and B. As with the previous, the interaction didn't have any effect. Figure 9 shows the visual test results.
Signature validation time is so small and thus its performance is expected to be the same as the encryption time. No factor is expected to have a large effect on the metric and the effect is expected to be dominated by errors. These errors generally come from the CPU capability and memory which were not accounted for. Table XI shows the results of this time analysis. The results match the discussion above. Furthermore, the visual test showed lots of outliers in this case, as seen in Figure 10 . Further factors can be taken to analyze such data correctly.
| Factor | Main effect | % variation explained | CI | Significant? | Important? |
|---|---|---|---|---|---|
| A | -0.025 | 7.773 | (-0.03, -0.01) | Yes | No |
| B | 0.006 | 0.487 | (-0.0006,0.01) | No | No |
| AB | 0.006 | 0.484 | (-0.0006,0.01) | No | No |
| Error | 91.256 | Yes! |
In this subsection, we discuss the remaining metrics which include response time 1, response time 2, response time 3 and the overall time. The objective of these measurement is to see the effect of security on the overall system performance.
Log transformation was used to model RT1 as well. Since RT1 is time between clients sending the request and the server receiving it, security is not involved. Thus, the key size should not have much effect on the analysis. Table XII shows the results of RT1 analysis.
| Factor | Main effect | % variation explained | CI | Significant? | Important? |
|---|---|---|---|---|---|
| A | 0.05 | 0.97 | (0.03, 0.07) | Yes | No |
| B | 0.49 | 82.56 | (0.47,0.50) | Yes | Yes |
| AB | 0.05 | 0.73 | (0.03, 0.06) | Yes | No |
| Error | 15.74 | No |
As can be seen from the table, the number of clients had the largest effect. Others had almost 0 effect except for the error. The error here could be due to network delay or processing delay since the communication is between different ports. Figure 11 shows the visual tests, including the Q-Q plots and residuals. The figures show that the model is almost normal (for log transformation).
Log transformation was used to model RT2 as well. Since RT2 involve some decryption and signature verification from the server side, the effect of the key size should be more. However, the number of clients should dominate the model while the effect of the key size is minimal. Table XIII shows the results of RT1 analysis.
| Factor | Main effect | % variation explained | CI | Significant? | Important? |
|---|---|---|---|---|---|
| A | 0.02 | 0.75 | (0.01, 0.02) | Yes | No |
| B | 0.17 | 78.88 | (0.16,0.17) | Yes | Yes |
| AB | 0.02 | 0.82 | (0.01, 0.02) | Yes | No |
| Error | 19.55 | No |
The results from the experiment did not confirm the discussion above. This could be due to experimental error or a missing factor that we didn't consider in theoretical analysis. The number of clients is still the dominant while others had almost 0 effect except for the error. Figure 12 shows the visual tests, including the Q-Q plots and residuals. The figure shows that the model is almost normal (for log transformation).
RT3 was done by log transformation of the model as well. Similar to RT2, the key size should have a slightly higher impact on the data due to encryption/decryption and signature/validation involved. However, those times were negligible, thus the results are expected to have negligible factor as well. Table XIV shows the results of RT3 analysis.
| Factor | Main effect | % variation explained | CI | Significant? | Important? |
|---|---|---|---|---|---|
| A | 0.01 | 0.37 | (0.005, 0.02) | Yes | No |
| B | 0.19 | 80.31 | (0.1,08.19) | Yes | Yes |
| AB | 0.03 | 1.58 | (0.02, 0.03) | Yes | No |
| Error | 17.74 | No |
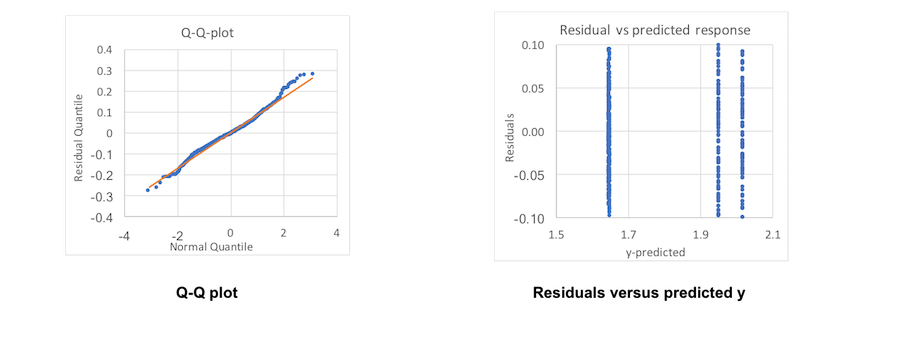
As can be seen the error was slightly higher than others due to the communication overhead introduced by the fact that communicating the response back. This error is expected to be higher in case of real time network and at the point, the networking factor and delay is a must. Adding this factor could be a future work to consider. Figure 13 shows the visual test analysis for this time.
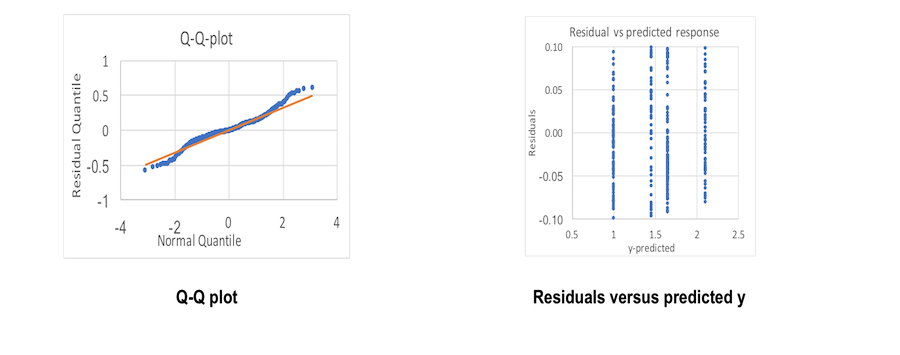
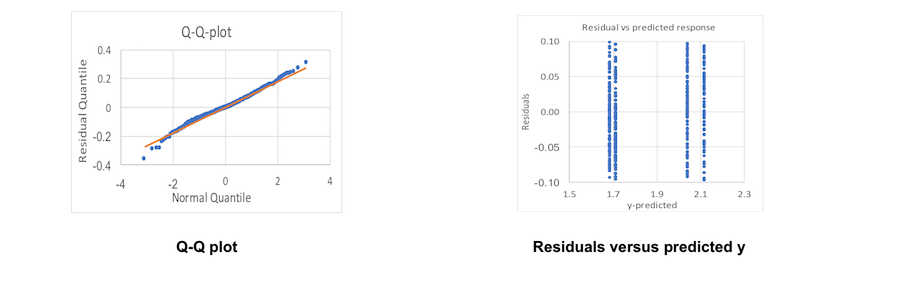
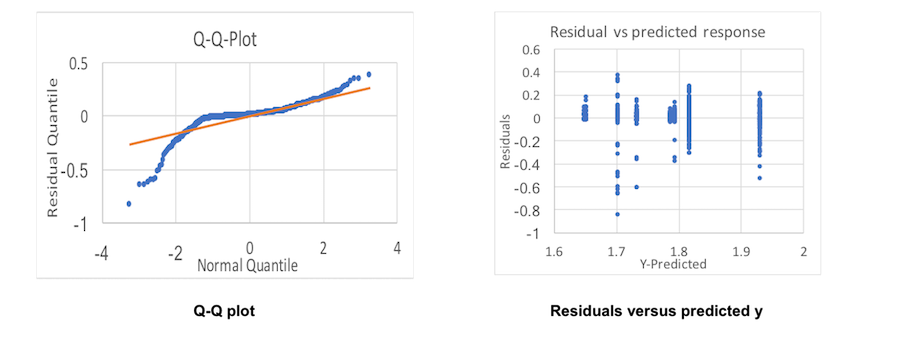
The overall time is mostly dominated by the key generation time in this phase. Thus, its results are expected to follow key generation time in performance. Table XV shows the results of the overall time. Note that this is also a log transformation model. As expected most the effect went to both key size and number of clients. This matches the results of the key generation time analysis and our discussion above. Figure 14 shows the visual test for the model.
| Factor | Main effect | % variation explained | CI | Significant? | Important? |
|---|---|---|---|---|---|
| A | 0.33 | 42.66 | (0.32 0.34) | Yes | Yes |
| B | 0.35 | 47.86 | (0.34,036) | Yes | Yes |
| AB | -0.004 | 0.01 | (-0.004, 0.008) | No | No |
| Error | 9.48 | No |
This section summarized a detailed performance analysis of the setup phase included in the project. This was done in terms of key generation time, encryption time, decryption time and many others. These metrics were system and security metric which included workload and system factors. Two factors, key size and number of clients, each with two levels were considered. Results showed good modeling for many of the metrics. Most of the error where bellows 20%. Thus, the chosen factors for this metric were good enough to analyze the data and understand the effects. It should be noted that the interactions effect was minimum which can be explained by the fact that factors do not interact. Table XVI summarize the results that were presented in this section
| Metric | Was A effective? | Was B effective? | Was error effective? |
|---|---|---|---|
| Key generation time | Yes | Yes | No |
| Encryption time | No | No | Yes |
| Signature time | Yes | No | No |
| Decryption time | Yes | Yes | No |
| Validation time | No | No | Yes |
| Key reconstruction | Yes | Yes | No |
| Response time 1 | No | Yes | No |
| Response time 2 | No | Yes | No |
| Response time 3 | No | Yes | No |
| Overall time | Yes | Yes | No |
In this section, we present the results for the request response phase. As discussed in Section 4, three factors, each with 2 levels were to be chosen for evaluating requests/response phase. Thus, 8 experiments are to be done and four data are to be collected. We didn't consider a full analysis as we did with the setup phase. Thus, only RTs and overall time will be recorded for this part. Similarly, we used log models for all the metric reported and this is due to domain knowledge about response and CPU times. Table XVII shows the overall average results for the four metrics and the following sections will discuss their analysis in detail. Note that for these experiments. Factor A is the number of request, factor B is the number of client and factor C is the crypto-algorithm time.
| I | A | B | C | RT 1 | RT 2 | RT 3 | Overall time |
|---|---|---|---|---|---|---|---|
| 1 | -1 | -1 | -1 | 0.25 | 0.70 | 1.65 | 1.66 |
| 1 | 1 | -1 | -1 | 0.26 | 0.69 | 1.65 | 1.65 |
| 1 | -1 | 1 | -1 | 0.57 | 1.01 | 1.70 | 1.75 |
| 1 | 1 | 1 | -1 | 0.68 | 1.02 | 1.73 | 1.75 |
| 1 | -1 | -1 | 1 | 0.29 | 1.33 | 1.79 | 1.88 |
| 1 | 1 | -1 | 1 | 0.31 | 0.32 | 1.79 | 1.90 |
| 1 | -1 | 1 | 1 | 1.05 | 1.65 | 1.93 | 2.09 |
| 1 | 1 | 1 | 1 | 1.11 | 1.66 | 1.82 | 2.07 |
This subsection presents the results for response time analysis. Note that it is expected that we have a high error in such metrics in these experiments. This error can be due to the network and CPU parameters which we have not considered as part of our changeable parameters.
RT1 analysis results are presented in Table XVIII. As can be seen the chosen parameter for this time were not effective. Number of clients were effective and 50% of the model. The error was too high due to parameters that we didn't consider within this phase. These parameters may include network or CPU delay which generally was not measured. Future work may include those parameters along with varying the number of computers to have better modeling of this part.
| Factor | Main effect | % variation explained | CI | Significant? | Important? |
|---|---|---|---|---|---|
| A | 0.02 | 0.34 | (0.01,0.04) | Yes | No |
| B | 0.29 | 50.64 | (0.27,0.3) | Yes | Yes |
| C | 0.13 | 9.69 | (0.11,0.14) | Yes | No |
| AB | 0.02 | 0.17 | (0.003, 0.03) | Yes | No |
| AC | -0.01 | 0.02 | (-0.02,0.01) | No | No |
| BC | 0.10 | 6.54 | (0.09,0.12) | Yes | No |
| ABC | -0.01 | 0.03 | (-0.02,0.01) | No | No |
| Error | 32.58 | Yes |
Figure 15 shows the visual tests for the experiment. As can be seen, the model is not perfectly normal and error seems not to have a constant standard deviation.
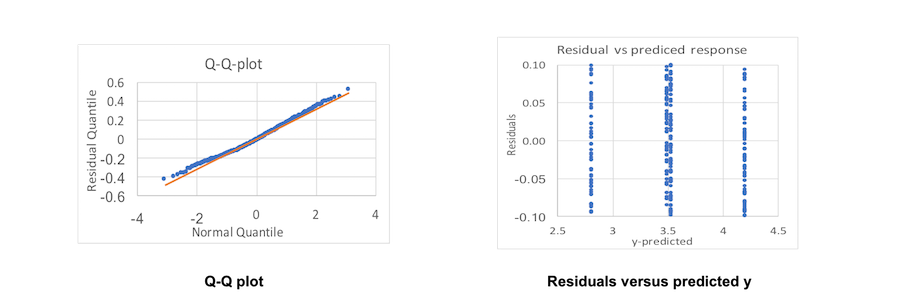
RT2 seems to have better analysis than RT1. The results of this time are presented in Table XIX. The number of clients and the crypto-algorithm seems to explain most of the models. Others are distributed almost equally between the other factors and error.
| Factor | Main effect | % variation explained | CI | Significant? | Important? |
|---|---|---|---|---|---|
| A | -0.12 | 7.01 | (-0.13, -0.12) | Yes | No |
| B | 0.29 | 38.12 | (0.28,0.30) | Yes | Yes |
| C | 0.19 | 16.95 | (0.18,0.20) | Yes | Yes |
| AB | 0.13 | 7.67 | (0.12,0.14) | Yes | No |
| AC | -0.13 | 7.40 | (-0.13, -0.12) | Yes | No |
| BC | 0.13 | 7.68 | (0.12,0.14) | Yes | No |
| ABC | 0.13 | 7.22 | (0.12,0.13) | Yes | No |
| Error | 7.95 | No |
Figure 16 shows the visual tests for the experiment. As can be seen, the model is perfectly normal except for some outliers and error seems to be having a constant standard deviation.
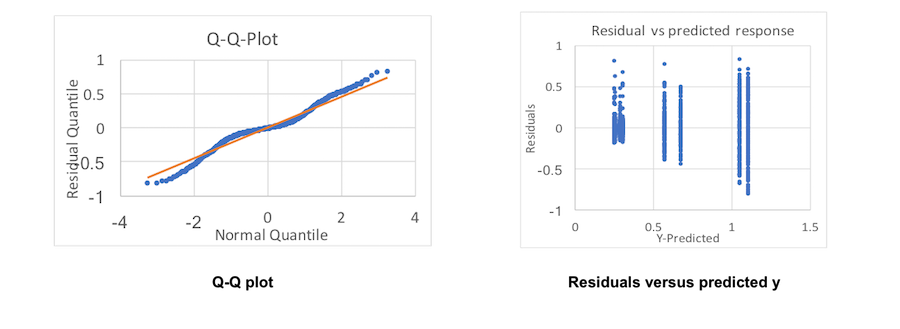
Like RT1, RT3 didn't have good results. Table XX shows the results for this metric. As can be seen, the error was more than 50% and only crypto- algorithm factor had a high effect on the model. A better model can be gotten by considering different factors, including the network and CPU effects.
| Factor | Main effect | % variation explained | CI | Significant? | Important? |
|---|---|---|---|---|---|
| A | -0.01 | 0.58 | (-0.015,-0.005) | Yes | No |
| B | 0.04 | 8.35 | (0.032,0.043) | Yes | No |
| C | 0.07 | 32.19 | (0.069,0.079) | Yes | Yes |
| AB | -0.01 | 0.71 | (-0.016,0.006) | No | No |
| AC | -0.02 | 1.65 | (-0.022,-0.011) | Yes | No |
| BC | 0.00 | 0.09 | (-0.002,0.009) | No | No |
| ABC | -0.02 | 2.12 | (-0.024,-0.014) | Yes | No |
| Error | 54.32 | Yes |
Figure 17 shows the visual tests for the experiment. As can be seen, the model is not perfectly normal and error seems not to have a constant standard deviation.
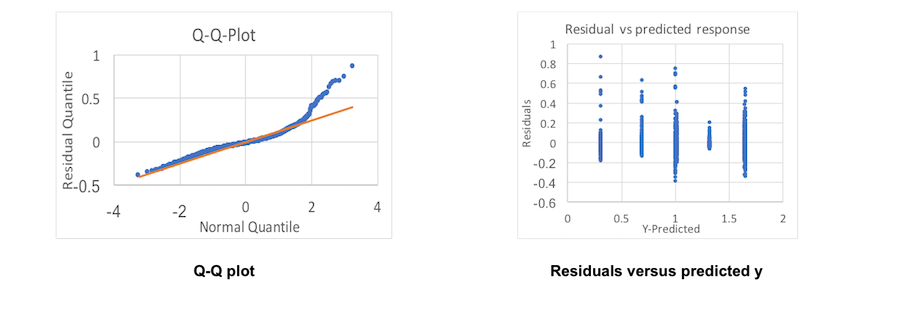
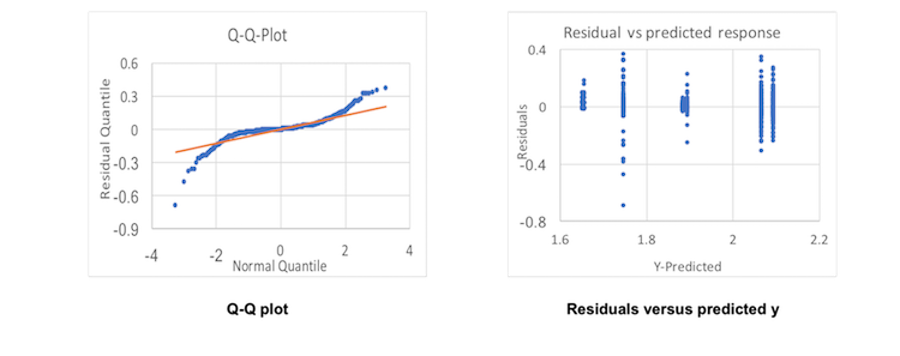
Overall time analysis is not dominated by any of the metric this time. The results are shown in Table XXI. As can be seen, Factor C, which is the crypto-algorithm type, has the most effect while error and the number of clients has less effect. The other factors and interactions hardly had any effect on the model.
| Factor | Main effect | % variation explained | CI | Significant? | Important? |
|---|---|---|---|---|---|
| A | -0.002 | 0.02 | (-0.006,0.002) | No | No |
| B | 0.071 | 16.20 | (0.067,0.075) | Yes | No |
| C | 0.142 | 65.04 | (0.138,0.146) | Yes | Yes |
| AB | -0.005 | 0.07 | (-0.009,-0.001) | Yes | No |
| AC | -0.002 | 0.01 | (-0.006,0.020) | No | No |
| BC | 0.024 | 1.87 | (0.020,0.028) | No | No |
| ABC | -0.005 | 0.09 | (-0.009, -0.001) | Yes | No |
| Error | 16.70 | No |
Figure 18 shows the visual tests for the experiment. As can be seen, the model is perfectly normal except for some outliers and error seems to have a constant standard deviation.
This section summarized the analysis of the request/response phase using three factors: number of clients, number of requests per client, and the crypto-algorithm used. Table XXII summarizes the results presented. Results were not as good as the performance of the setup phase was. The number of requests per client hardly had any effect on the parameters. The reason for that is the fact that clients send only one request at a time and thus cannot overload the server with many requests at the same time. Different factors can be considered in the future to have better analysis.
| Metric | Was A effective? | Was B effective? | Was C effective? | Was error effective? |
|---|---|---|---|---|
| Response time 1 | No | Yes | No | Yes |
| Response time 2 | No | Yes | Yes | No |
| Response time 3 | No | No | Yes | Yes |
| Overall time | No | No | Yes | No |
As part of our work in multi-cloud computing, a multi-cloud management platform, OpenADN, was deployed before in our labs. Such platforms incorporated security by encryption and signature validation using traditional cryptosystem techniques: RSA and AES. This work analyzed the performance of OpenADN under those security considerations using full factorial design. First, we divided the procedure into setup and request/response phases. We evaluated the first phase with two factors and 10 performance metrics. Factors were key size and number of clients. Metrics included key generation time, encryption time, signature and many others. The results of that part showed a good modelling for most of the metrics. Further, we analyzed the second phase with three factors and four metrics. Factors were the number of clients, number of requests and the crypto-algorithm used. Metric were the overall time and three different RTs. Results showed that the chosen factors were not the perfect once in this case. Future work would choose different factors and have a better analysis of the second phase. Further, more sophisticated crypto-system is planned to be implemented in order to be supported by our platform.
[PAU13] Subharthi Paul, Raj Jain, Jianli Pan, Jay Iyer, and Dave Oran, "OpenADN: A Case for Open Application Delivery Networking," Proceedings of International Conference on Computer Communications and Networks (ICCCN) 2013, Nassau, Bahamas, July 30-Aug 2, 2013, http://www.cse.wustl.edu/~jain/papers/adn_ic3n.htm .
[PAU13b]Subharthi Paul, Raj Jain, Mohammed Samaka, Jianli Pan, "Application Delivery in Multi-Cloud Environments using Software Defined Networking," Computer Networks Special Issue on cloud networking and communications, December 2013, DOI: 10.1016/j.comnet.2013.12.005, http://www.cse.wustl.edu/~jain/papers/comnet14.htm .
[PAU14] S. Paul, "Software Defined Application Delivery Networking," 2014, All Theses and Dissertations (ETDs), Paper 1331, http://openscholarship.wustl.edu/etd/1331 .
[PAU12] Subharthi Paul, Raj Jain, "OpenADN: Mobile Apps on Global Clouds Using OpenFlow and Software Defined Networking," First International workshop on Management and Security technologies for Cloud Computing (ManSec-CC) in conjunction with IEEE Global Communications Conference (Globecom), Anaheim, CA, 2012, pp. 719-723, http://www.cse.wustl.edu/~jain/papers/adn_gc12.htm.
[GUP16] Lav Gupta, Prof Raj Jain, Prof Mohammed Samaka, Prof Aiman Erbad, and Dr. Deval Bhamare, "Performance Evaluation of Multi-Cloud Management and Control Systems," Recent Advances in Communications and Network Technology, 2016, Vol. 5, Issue 1, pp. 9-18, http://www.cse.wustl.edu/~jain/papers/racnt.htm.
[AES_wi] Wikipedia, "Advanced Encryption Standard," [online] Available: https://en.wikipedia.org/wiki/Advanced_Encryption_Standard, (accessed October 4, 2017).
[RSA_wi] Wikipedia, "RSA (cryptosystem)," [online] Available: https://en.wikipedia.org/wiki/RSA_(cryptosystem), (accessed October 4, 2017).
[BOK17] M. U. Bokhari, and Q. M. Shallal, "Evaluation of Hybrid Encryption Technique to Secure Data during Transmission in Cloud Computing," International Journal of Computer Applications, vol. 166, no. 4, 2017, pp. 25-28, https://pdfs.semanticscholar.org/a28b/3c33f8ebb29983ddd1f223513c7f1d11cf39.pdf.
[KHA14] N. Khanezaei and Z. M. Hanapi, "A framework based on RSA and AES encryption algorithms for cloud computing services," IEEE Conference on Systems, Process and Control (ICSPC), Kuala Lumpur, Malaysia 2014, pp. 58-62, http://ieeexplore.ieee.org/abstract/document/7086230/.
[SIN16] S. R. Singh, A. K. Khan and S. R. Singh, "Performance evaluation of RSA and Elliptic Curve Cryptography," 2016 2nd International Conference on Contemporary Computing and Informatics (IC3I), Noida, 2016, pp. 302-306, http://ieeexplore.ieee.org/abstract/document/7917979/.
[AlI15] A. I, Ali, "Comparison and Evaluation Of Digital Signature Schemes Employed In NDN Network," International Journal of Embedded systems and Applications(IJESA), Vol. 5, No. 2, June 2015, pp.15-29, https://arxiv.org/abs/1508.00184.
[KHA15] A. Khatoon, Dr. Ataul and A. Ikram, "Performance Evaluation of RSA Algorithm in Cloud Computing Security," International Journal of Innovation and Scientific Research, Vol. 12 No. 1 Nov. 2014, pp. 336-345, http://citeseerx.ist.psu.edu/viewdoc/summary?doi=10.1.1.682.1355.
[PRA14] P. Prajapati, N. Patel, R. Macwan, N. Kachhiya, and P. Shah, "Comparative analysis of DES, AES, RSA encryption algorithms," International Journal of Engineering and Management Research, vol. 4, no. 1, 2014, pp.132-134, http://www.ijemr.net/Feb2014Issue/ComparativeAnalysisOfDESAESRSAEncryptionAlgorithms(132-134).pdf.
[FAR12] S. Farah, M. Y. Javad, A. Shamim, T. Nawaz, "An experimental study on Performance Evaluation of Asymmetric Encryption Algorithms," Recent Advances in Information Science, December 2012, pp. 121-124, https://pdfs.semanticscholar.org/2e6f/3d4f10c64cc307485c6cb963e9987d674a60.pdf.
[PYCRY] Ptyhon, "pycrypto 2.6.1," [online] Available: https://pypi.python.org/pypi/pycrypto , (accessed October 4, 2017).
| AES | Advanced Encryption Standard |
| CI | Confidence Interval |
| CPR | Client Private Key |
| CPU | Client Public Key |
| GC | Global Controller |
| LC | Local Controllers |
| MCAD | Multi-Cloud Application Delivery |
| NC | Node Controllers |
| RSA | Rivest-Shamir-Adleman |
| RT | Response Time |
| RT1 | response Time 1 |
| RT2 | Response Time 2 |
| RT3 | Response Time 3 |
| SPR | Server Private Key |
| SPU | Server Public Key |