| Venkatakrishnan Raghavan, vraghavan (at) wustl.edu (A paper written under the guidance of Prof. Raj Jain) |
Download |
Wi-Fi is a Wireless Local Area Network (WLAN) technology using 2.4 GHz and 5 GHz ISM bands (Industrial, Scientific and Medical) for allowing electronic equipment to be interconnected. [Rappaport96] tells us that wireless signal strength, measured in decibels (dB) experiences interference and multipath fading when transmitted over the channel. Several factors affect the signal strength. In this study, we select some commercially available adapters and antenna equipment to transmit a wireless signal and measure the received signal strength. We do statistical performance comparison using one-factor [Jain91] full factorial analysis and determine the best transmission combination equipment.
Keywords: Wi-Fi, adapter, path-loss, fading, propagation, antenna, RSSI, One-Factor Experimental Design
Wi-Fi is the most commonly used wireless networking technology which follows the IEEE 802.11x standards. It allows two devices to exchange information without the need for physical wired connection. It makes use of the long wavelength-low frequency radio wave (3 KHz to 300GHz) portion of the electromagnetic spectrum. In today’s scenario, [Sendra10] the 2.4GHz and the 5GHz bands of the RF spectrum are popularly used for Wi-Fi signals.
When a signal is transmitted into the wireless channel, several factors affect its propagation. The signal experiences reflection, refraction, diffraction, scattering and several other effects of the channel. The receiver device could receive multiple copies of the transmitted signal, each of which has taken a path with different delays. Such a reception adversely affects the signal quality and is known as multipath fading. Atmospheric ducting, ionosphere reflection, scattering and diffraction due to obstacles are some effects to mention. Mobility of transmitter or receiver induces another fading known as mobility induced fading. Several models exist to quantify the fading that occurs in the channel. The free space path loss model [Rappaport96, Xu13] is the simplest of them all and assumes that there are no obstacles between the transmitter and the receiver.

-d is the distance between the transmitter and receiver.
-Pr is the received signal power.
-X is a Gaussian random variable with 0 mean.
-d0 is the reference distance (since we always have comparison based Power level measurement).
-n is the parameter which makes the above equation suitable for different propagation models.
Typical values: 2 ≤ n ≤ 4 is for outdoor environment and 4 ≤ n ≤ 6 is for indoor environment.
[Chavan11] Rayleigh model applies when there exist many small reflectors in the path, Rician model applies when there is a large Line of Sight (LOS) path as well as when there exist many independent paths. There exist several such models which specifically cater to the environment such as urban area propagation (Okamura, COST Hata model) etc.
We thus come to know that the environmental factors affect the propagation of the wireless signal. Keeping the environment a constant, the next factor which decides the transmission and reception quality is the electronic equipment used to transmit and receive. We know from [Krzysztof12] that higher the received power (RSSI) results in higher throughput. The scope of this study will discuss how the transmission and reception is affected by choice of transmission equipment while keeping the reception device a constant. The measurement done with the aim of being able to select a good transmission combination for several future applications.
Wireless signal is transmitted into the channel using a transmission equipment. Routers are devices that forward packets into a network. Wireless routers will require antennas to broadcast these packets into the wireless channel. In this study, we make use of routers, adapters and antennas as transmission equipment.
Information that is to be exchanged is not a form of wireless signal by default. They could be a file on a computer, live voice/video transmission etc. It is necessary to have a device that has wireless connectivity in order to share these data. Commercially, several adapters are available which provide this connectivity to older devices. Newer devices come with built-in adapters, which can be boosted for better performance by using an external adapter. Since these adapters work on Wi-Fi, they are based on IEEE 801.11 standards themselves. They send data via radio waves to routers that pass it on to broadband modems or internal networks.
Antenna is a device which greatly increases the reliability and stability of the wireless signal and thus provides better wireless connectivity. The connection range of a Wi-Fi adapter highly depends on the power gain of the antenna, a numeric quantity that is measured in decibels (dB). For greater range, we need an antenna working with higher levels of power, which means the antenna has higher power gain.
There are several types of antennas that exist. Antennas that transmit/receive signals in all directions are known as Omni-directional antennas. They are commonly used in wireless adapters and mobile phones. Since omni-directional antennas transmit uniformly in all directions, their power gain in any specific direction is generally lower than the adapter which transmits in a particular direction. The latter are known as directional antennas. Some adapters may visually appear to not have any antenna for their working. There still exist a class of antennas in these adapters called chip antenna. This is a semiconductor chip made up of high permittivity and low loss material. Adapters working with chip antennas are highly compact in size, but have much lower range. This study deals with omni-directional and directional antennas only.
[Bardwell13] explains that RSSI is a radio frequency (RF) term that indicates the power level of an RF device. It is a value measured in dB [Bose07] which tells us about RSSI and that it is a higher the better metric (HB) which is used to determine signal quality. From [Lui11, EMFWISE] we know that RSSI value is known to reduce with increase in distance from the transmission source. In practice,for typical WiFi receivers, RSSI value of -75 dB provide a reasonable service. -85 dB provides an acceptable service, while -100 dB provides a barely usable service. Any lower value provides no service at all. We can measure RSSI using several hand held equipment that are commercially available. Several free-of-cost software tools exist which also help us measure the RSSI of a signal. Section 3 describes the antennas, adapters and measurement tool used in this study.
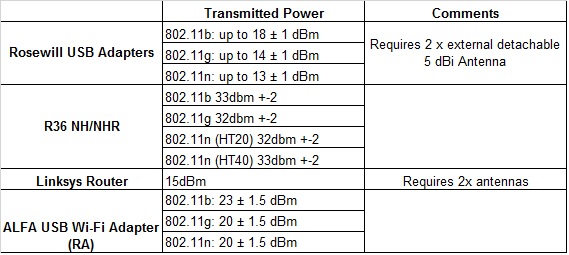
In this study, the workload was the wireless signal which was transmitted using different combinations of wireless adapter and antenna[Xu13]. The transmission power of the adapters used in the study are listed in Table 1.
The transmission power of the adapters used in the study are listed in Table 1.
TABLE 1 Transmitted Power of Select Workloads
A fifth router, BRYAN SKY was used, which came with its own antenna. It is an Open Mesh (OM2P-US) router working on 802.11n, but since it was not an open-source equipment, it was used only for relative performance analysis as the future applications are expected to require open-source equipment.
Eight different antennas which were available at our disposal were used in the study. For the purpose of easy tabulation, they were named as RA, ROSA, R36A, Blue Mall, directional (ALFA), long (Super Power). Figure 1 shows the adapters and antennas that were used in the study. The shorter antenna (RA, ROSA, R36A) are 5dB rated while the longer ones (Blue Mall, Super Power, Global Style) were rated 9dB. The ALFA directional antenna is rated 7dB. The received power was the metric used for comparison in this experiment and was measured as the RSSI.
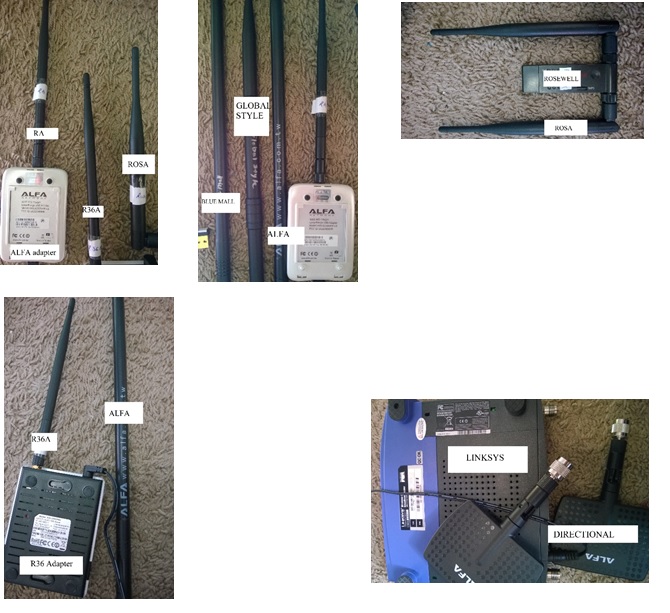
FIGURE 1 (left to right, top to bottom) ALFA Adapter with RA, R36A and ROSA Antennas; ALFA Adapter with Blue Mall, Global Style and ALFA antennas; ROSEWILL adapter with ROSA antenna;R36 adapter with ALFA antenna; Linksys router with directional antennas
inSSIDer Home edition v3 [pcmag, AH blog] was used as the measurement tool to measure the RSSI of the signal. The software was installed on a laptop with RTL8188EU wireless adapter from Realtek. The receiver adapter was a constant for all the combinations of transmission equipment. Figure 2 shows a screenshot of the inSSIDer software and gives information about the RSSI value measurement.
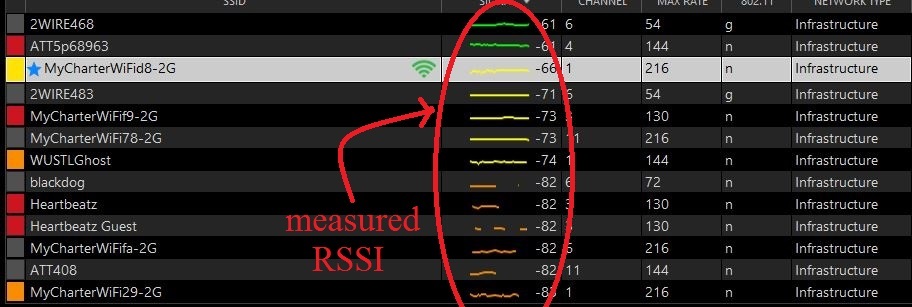
FIGURE 2: Screenshot of the RSSI measurement of wireless networks by inSSIDer.
The goal was to be able to select a good transmission combination for future wireless applications. With the available equipment, a One-factor full design was used with the factor being the adapter + antenna combination. The measured value was the RSSI, using inSSIDer tool. The distance of measurement from the transmission source was kept a constant for all workloads. Also, the environment where the experiment was conducted was kept identical for all the experiments.
The readings were taken as shown in the experiment setup in Figure 3. A similar setup was used for outdoor wireless path-loss model study by [Liechty07]. The receiver device was kept a constant for all readings.
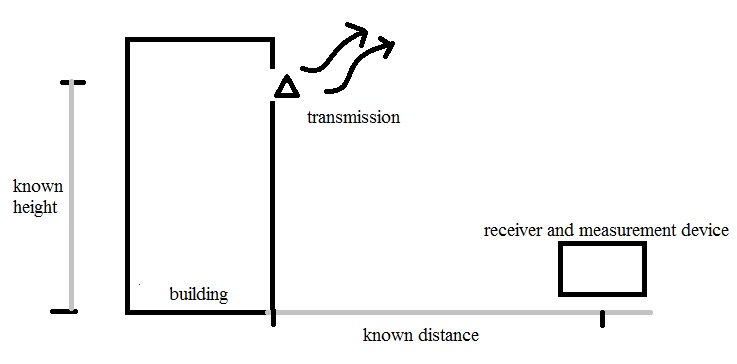
FIGURE 3: Diagram showing the experimental set up
Data was collected for the RSSI values of 13 different transmission equipment and shown on Table 2.
TABLE 2 Measured RSSI values for 13 different combinations of transmission equipment
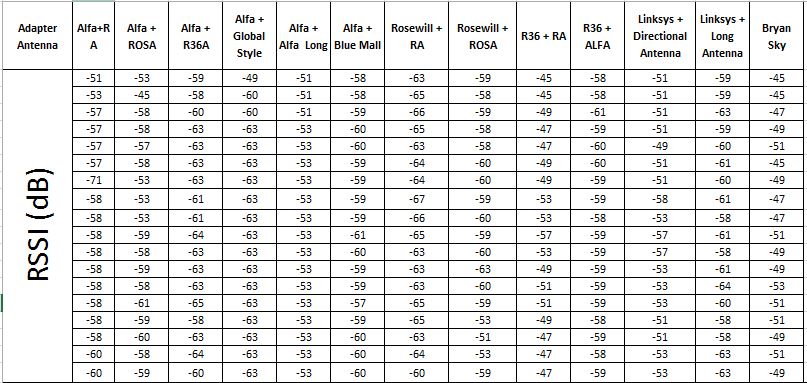
TABLE 3: Calculation of effects of each transmission combination
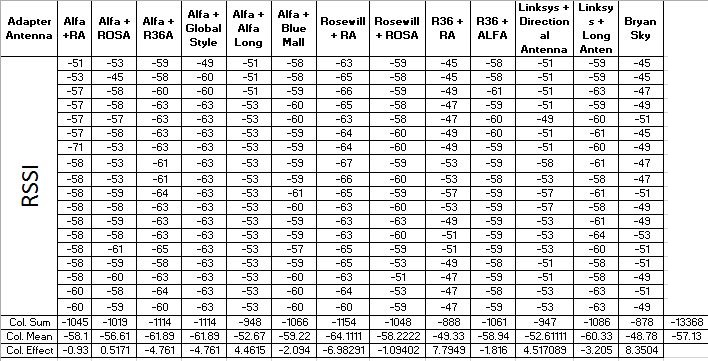
RSSI is a higher the better (HB) metric. We observe the grand mean to be -57.13 dB. It is desired to have a high value of column effect for the transmission pair to be the one receiving the highest RSSI.
We see from the Table 3 that BRYAN SKY (column 13) was observed to be the best transmission equipment with 8.35 dB better reception than the average. R36 adapter with RA antenna (column 9) performs second best with a 7.79 dB higher RSSI. ALFA+ALFA (column 5) receives 4.46 dB more signal than the average performance. We also see that Linksys router + directional antenna ranks third with 4.51 dB better reception than the average.
TABLE 4: Sum of Squares computation
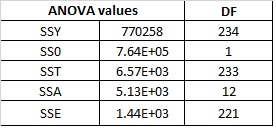
TABLE 5: ANOVA Table
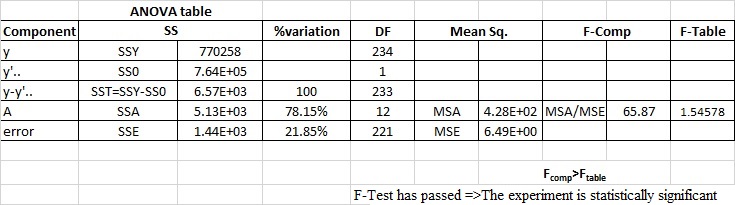
Table 4 shows the sum of squares and From the F-Test in Table 5, the experiment is statistically significant. We observe that variation in transmission equipment accounts for 78.15% of the variation in RSSI values.
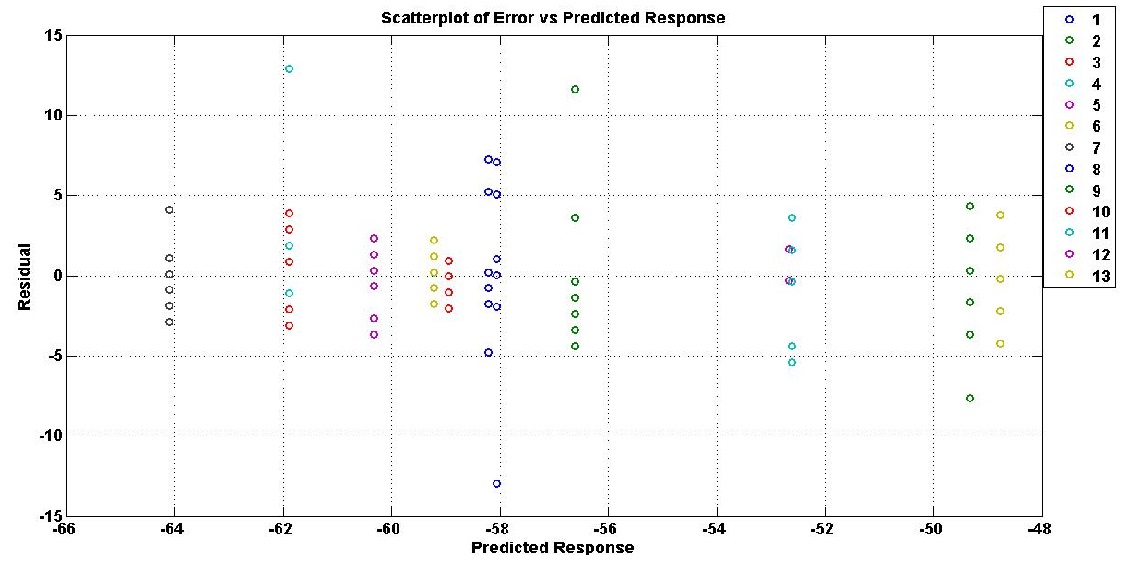
FIGURE 4: Error trend against the predicted RSSI values
We see from Figure 4 that there is no specific trend in the error pattern. However in few cases, we see an error magnitude to be larger than 0.1 times the predicted response. This occurred because a vehicle passed between the transmitter and the receiver and unknowingly a measurement was taken at that point. It was included in the data set to show that obstacles deteriorate the wireless signal quality. At ordinary circumstances when measurement was done without obstruction, the error values were small.
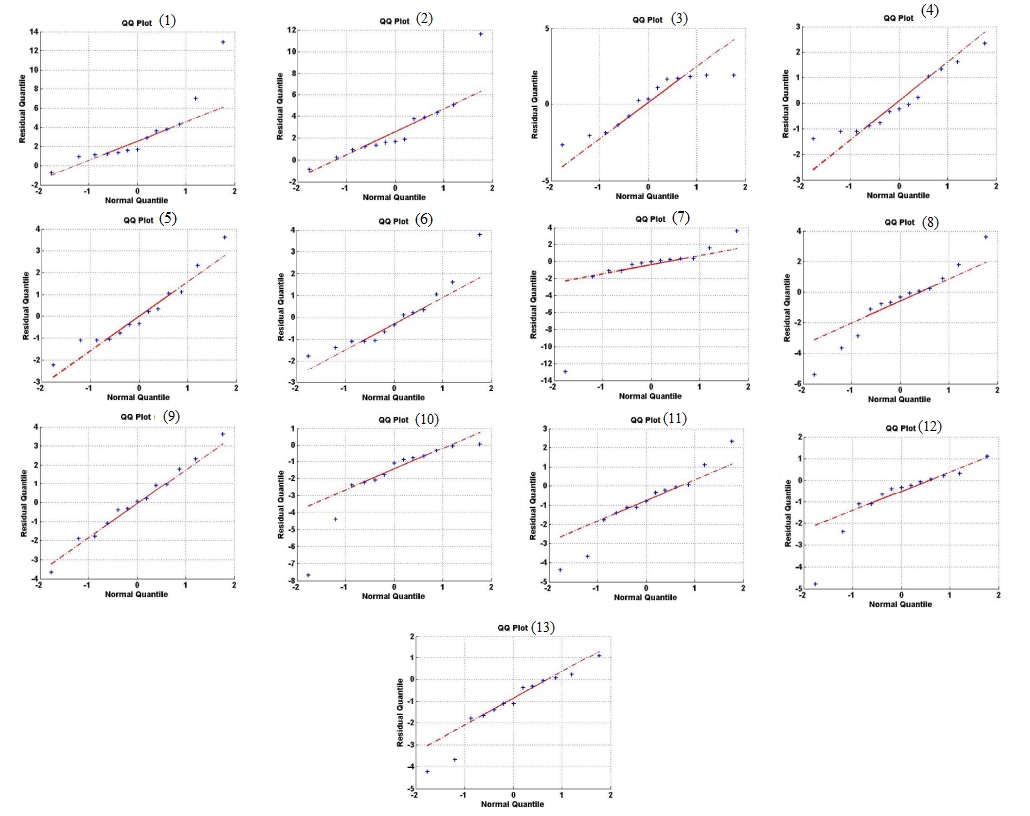
FIGURE 5: Quantile-Quantile plot of errors from (1) to (13) indicating the 13 factors used
Figure 5 shows the Quantile plot of the errors. We see that the individual factor errors are normally distributed with the exception of few head and tail outlier points which are explained to be the readings taken during interfering objects in the measurement path.
We have taken the RSSI measurements for 13 different transmission equipment and done a one-factor analysis to calculate the effect of each factor. After checking the normality of errors and doing the F-Test, it is seen from Table 5 that transmission equipment is an important factor in received signal power, thus making it necessary to check its significance.
TABLE 6: Confidence Intervals of the mean and the effects of all 13 workloads.
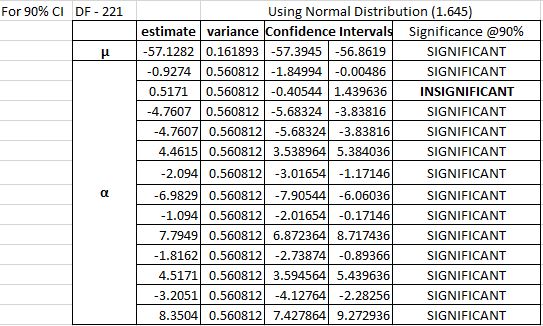
Table 6 shows the confidence intervals of all the effect terms. We can observe that only the ALFA adapter with the ROSA antenna had insignificant effect. Since this particular transmission combination is anyway not ranking among the top choices of transmitters, there isn’t much cause for concern due to its insignificance. The factors with high positive effects are observed to be significant.
This study was set to quantitatively measure the performance of several different combinations of adapters and antennas as transmission equipment. We have taken the RSSI measurements for 13 different transmission equipment and done a one-factor analysis to calculate the effect of each factor. After checking the normality of errors and doing the F-Test, it is seen that transmission equipment is an important factor affecting the RSSI. We have also seen from the previous section that the effects of the factors are significant.
After checking the significance of the experiment and the effects of each factor in the measured RSSI value, we can now decide the best factors i.e. workloads for obtaining good transmission. Table 7 shows the top three wireless transmitters based on their effect on the RSSI value.
TABKE 7: Top 3 choices of wireless transmitters
![]()
It is interesting to note here that even though Linksys router with directional antenna was not among the top 3 choices of wireless transmitters, it was much more consistent in transmission even in slightly obstructed paths. This is a mere observation made while collecting data and could be investigated for application in areas where the path experiences frequent obstruction.
W-LAN : Wireless Local Area Network
ANOVA :Analysis of Variance
RSSI :Receiver Signal Strength Indication
HB : Higher the better
RF : Radio Frequency
ISM : Industry Scientific Medicine
LOS : Line of Sight