| Lav Gupta, lavgupta (at) wustl.edu (A paper written under the guidance of Prof. Raj Jain) |
Download |
Abstract: Enterprises find hiring resources from cloud service provider less expensive as compared to buying physical servers and networking equipment. After gaining experience with single clouds, they now are moving towards multi-cloud scenario to reap the benefits of cost, performance and reliability. To be able to use resources across multiple clouds requires use of a control and management platform that would allow enterprises to deploy and manage their applications across the best clouds and best resources that meet their objectives. Such platforms are multi-threaded, distributed and highly complex. They need to be optimized to perform well. For optimization to succeed, it has to be preceded by profiling and performance evaluation. In this paper we present techniques to profile such platforms and use profiling data with the two factor full factorial design to get a good insight into what needs to be optimized.
Keywords: Cloud Computing, Multi-Cloud, Cloud Service Provider, Network Service Provider, OpenADN, Profiling, Optimization, performance evaluation, cloud management and control, full factorial design
According to the marketing intelligence company IDC, cloud computing market was worth US$ 45 billion in 2013, which is the same as the total value of shipments of physical servers [cloud13]. This shows the growing importance of cloud computing among the modern enterprises. A recent survey conducted by Information Week marco13] shows that 79% of the enterprises are using multiple public clouds with about 13% using 6 or more clouds! Being able to deploy and manage resources across multiple clouds is, therefore, becoming an important requirement for the enterprises. In our discussion in this paper, enterprises include those that hire virtual resources for their own applications or the Application Service Providers (ASPs) who provide services to others. To manage applications across multi-cloud infrastructure these enterprises need an appropriate control and management platform. One such a platform, called OpenADN, is under development at Washington University in St Louis and has been used for this study.
Cloud Service Providers (CSPs) offer their resources through diverse control and management platforms, like OpenStack and EC2. These platforms present to the users a virtualized view of the physical resources available in one or more datacenters. Similarly, Network Service Providers (NSPs) offer virtual network services, to link up multiple clouds, through management and control platforms like OpenDaylight. In such a situation enterprises obtaining and using computing resources from many CSPs and network services from NSPs would have to deal with many different management and control platforms. This would make their lives difficult unless there is some kind of a multi-cloud management platform to assist them. One such platform called OpenADN is under development at the Washington University in St Louis. This platform would sit between the enterprises and the multiple clouds and provide to them an integrated view of all the resources so that they can deploy and manage multi-cloud applications with ease.
Multi-cloud management softwares, like OpenADN, are complex. They generally use multithreading technique of software modularization and concurrent execution. This makes understanding their operational behavior difficult. At the same time, if the platform software has not been optimized from the enterprises' point of view, then the resources would be inefficiently utilized resulting in increase in operational expenditure. Optimization, on the other hand, can be expensive and time consuming and needs apriori understanding of the platform behavior. This can be done through profiling based performance evaluation. This paper discusses how such a platform can be modeled and its performance evaluation carried out to obtain data for optimization. Section 2 gives an understanding of architecture of the OpenADN platform that was profiled and evaluated so the readers can appreciate the complexity of such a platform. Section 3 deals with profiling and optimization techniques relevant to multi-cloud platforms. Section 4 details the Performance modeling of OpenADN, selection of profiling techniques and the experimental technique use for performance evaluation. Section 5 describes the profiling methodology used, the virtual set up for conducting the experiment and the actual profiling data obtained. Section 6 covers the two factor full factorial design and conducting performance evaluation and discussion of the results obtained. Section 7 summarizes the paper.
OpenADN is a multi-cloud management system. It is interposed between various single cloud management systems and the enterprise intending to use resources on multiple public clouds. It has two types of external interfaces. The first set of interfaces is for application developers, application architects, and application deployment administrators to define the application resource requirements and deployment policies. The second set of interfaces allow OpenADN to interact with the cloud management and control software of the cloud service providers to manage their virtual resources.
The key components of the OpenADN platform are shown in Fig. 1:
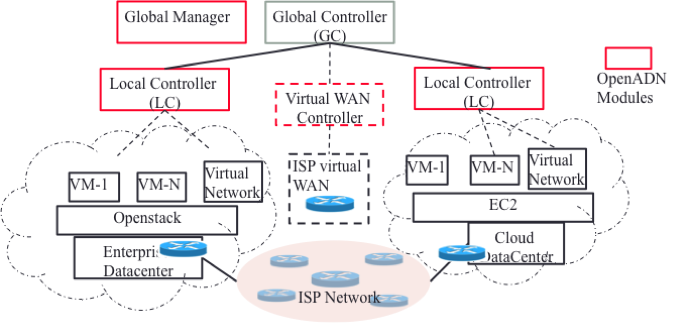
Figure 1. Key Components of OpenADN Platform
Modern distributed applications like healthcare monitoring and delivery and mobile apps benefit from geographically distributed deployments. This way they are able to serve their global user base and also ensure performance and availability. To manage such a deployment, platforms like OpenADN are designed to be distributed, multi-threaded systems. Considering the geographical spread of resources, a part of control activities in OpenADN are centralized in the global controller making it easy to introduce new service, propagate new polities and troubleshoot problems. However, keeping view the latencies of a highly distributed data plane, tasks relating to a data center are controlled by a local controller.
The platform needs to allow the application administrator to configure policies for distributing the deployment across multiple datacenters and managing and controlling the deployment at runtime. These policies include specifying how to distribute the application delivery network deployment initially and during the runtime. It is important to decide when and where to instantiate/shutdown/move new/existing instances to support change in the application context. This massively distributed dataplane structure makes the performance evaluation of OpenADN difficult and calls for specialized techniques that we shall discuss in the following sections.
Most of the control plane code has been implemented in Python while the data plane has been implemented in a mix of C and Python. The total size of the codebase is nearly 10,000 lines of code. OpenADN has been designed as modular software for better code readability and maintainability. This has allowed parts of the code to be developed and tested separately and in parallel. Modularity also restricts inter-module interference from propagating failure of any module. In a multi-cloud system, like OpenADN, multiple operations have to go on simultaneously to support multiple clouds, multiple users and multiple services. OpenADN has been partitioned into concurrently executable modules such that the system as a whole can perform many different tasks at the same time leading to better utilization of the hardware resources and ensuring that the system as a whole makes progress all the time. The platform modules and application services are run in separate processes. Therefore, application services are designed as external modules that need to connect to the platform through an external communication interface. Separating the platform and the application service allows the platform to independently handle failed application service without affecting other services. The services may run on the same or separate hosts. On the same host they use inter-process communication (IPC) while on different hosts they communicate using the network transport [paul14].
In each host, platform modules may run within the same address space (same process) and running in separate threads provides concurrency. The ports handling packet level services and message level services run in separate processes because kernel network stack has been used between message and packet level communication. Therefore, each port instance runs as a separate thread. These threads share the process heap and it provides them with a cheap way to communicate with each other. However, in-order to avoid fate-sharing completely, the only way for threads to communicate inside the platform process is through messaging.
In this sub-section we have seen some important design considerations that affect the performance of the OpenADN platform and should be known to the performance evaluator. In the next section we will see the techniques that can be used to study the execution behavior of such systems.
Complex softwares, like OpenADN, would always have hotspots or regions of code that consume disproportionate amount of computing, storage or network resources. For example, they may take longer CPU time than required. This would lead to leasing more resources than are necessary pushing up the deployment cost and increasing the latency. In z[waddington09] the authors have reported detailed work in the area of understanding behavior of software under execution and concludes that dynamic analysis is the best way to go. This involves examining program behavior under execution and gathering information about various events, which can be analyzed to decide whether optimization is necessary [gupta15]. In [eklov12] the authors say that new profiling, characterization, and modeling methodologies are required to understand the nature of architectural behavior under full system virtualization. Two candidate techniques are described in the following sub-sections.
Static analysis could either be done manually or through machines. In the manual method reading of program code and use of intuition are pre-dominant. Often this method fails to locate hotspots and results in sub-optimal code. Automatic analysis involves formal construction of program execution models. Model checking is often applied to multi-threaded programs to explore the loops and their interactions exhaustively to ensure correctness properties. Static-analysis techniques give assessment of relative time and temporal ordering and do not give absolute time [mars09]. For assessment of absolute times dynamic we applied dynamic profiling discussed in the next sub-section.
According to [waddington09] dynamic profiling is the only practical approach to behavioral analysis that can incorporate aspects of absolute time by inspecting behavior of a running system. It is an active form of profiling in which the system being measured explicitly generates information about its execution parameters. Two main families of dynamic profiling techniques are statistical profiling and deterministic. These are described below:
Statistical Profiling: randomly samples the program state and deduces where time is being spent. They can show the relative amount of time spent in user mode versus kernel mode and also the total execution time [wiki11]. For this reason this technique was not used for performance evaluation of OpenADN.
Deterministic Profiling: refers to all function calls, function returns, and exception events being monitored and precise timings made for the intervals between these events. This is usually done through injection of a set of additional instructions, called the instrumentation code, into the target program as shown in Figure 2. Some instrumentation systems count function activations while others count more fine-grained control flow transitions [chen10]. Instrumenting a program has to be done in a controlled manner else it can cause changes in the performance of the program. In Python, since there is an interpreter active during execution, the presence of instrumented code is not required to do deterministic profiling. Python automatically provides a hook for each event. Call count statistics can be used to identify bugs in code and to identify possible inline-expansion points. Internal time statistics can be used to identify hotspots that should be carefully optimized.
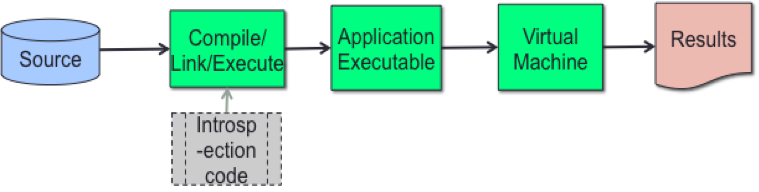
Figure 2. Deterministic Profiling
While deterministic technique allows the net effect of thread interaction to be studied through various events, concurrency profiling can be additionally used for multithreaded applications. Resource contention profiling collects detailed call stack information every time that competing threads are forced to wait for access to a shared resource. Concurrency visualization also collects more general information about how multithreaded application interacts with itself, the hardware, the operating system, and other processes on the hosts. It can help locate performance bottlenecks, CPU underutilization and synchronization delays [microsoft13] [Oracle12]. An example of data collected through concurrency profiling is given in sub-section 5.3.
This section defines the model of OpenADN that we have used for carrying out its performance analysis.
The main goal of the study is to examine whether the OpenADN platform has hotspots i.e. there are some parts of the platform that consume unduly large amount of computer resources. We try to locate these hotspots and then apply the experimental design techniques to find whether any of the located hotspots have significant impact on or metric described in Sub-section 4.3. The actual set of the experiment described in detail in Subsection 4.4 would be used as the basis for carrying out the collection of profiling data using techniques mentioned in Section 3.
We now attempt to define the system considering the description of OpenADN given in Section 2. We may recall that OpenADN allows enterprises to form application specific clouds using resources from a number of cloud service providers each of which may use physical resources from one or more datacenters. The system, therefore, consists of the multi-cloud management and control platform that receives inputs from the application development and deployment environment. It then obtains and manages resources from a number of cloud providers. The system boundaries are defined by the northbound and southbound interfaces that it has to the outside world. Interfaces and their functions are shown in Figure 3.
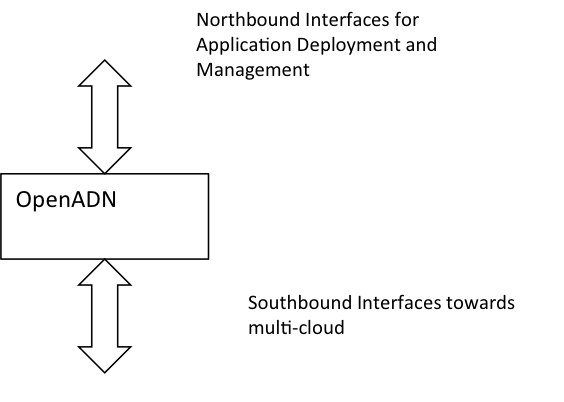
Figure 3. OpenADN System Boundary
OpenADN offers most services offered by packages like IBM Smart-Cloud Orchestrator, Dell Multi-Cloud Manager and ElasticBox. Its uniqueness, however, lies in the additional application and network layer services it offers for highly distributed and multi-threaded applications to run on multiple clouds. These services include:
The expected outcome is effective use of resources, assurance of meeting quality of service and dynamically ensuring effective operation of the system. However, at times and in some circumstances the outcome may not be as expected and the system may result in sub-optimal use of resources resulting in higher cost. Performance parameters like latency may be met for some applications and may not be met for others at all times. Communication among message level or packet level devices may take unduly long time. These issues were kept in mind for deciding metrics and parameters as discussed in the next sub-section.
The main metric is the CPU time taken to execute the platform software during the complete process of bootstrap and as the services start. Execution times for individual functions that consume a large amount of time would be of interest. The system parameters include: the type of virtual machines setup, storage capacities, intra and inter cloud network bandwidth. The workload parameters that affect the metric are the users’ requests for services, types of services – message and packet, amount of resources available.
a) Evaluation is done by gathering data through multi-level profiling. Considering the multi-threaded and distributed nature of OpenADN, deterministic profiling techniques have been chosen to be the mainstay of the performance evaluation. As we shall see in the next section, profiling at different levels, from coarse to fine-grained has been used to be able to isolate areas of the code that need to be optimized.
b) The existing prototype of OpenADN was used to set up experiment and take measurements. The platform was loaded and executed in the virtual environment as described in the next section. Experiments were conducted for different workloads involving varying number of clients and hosts. The effect on CPU times of various functions of OpenADN was observed. From a large amount of data collected, relevant data was selected to conduct experimental analysis as described below.
c) The experiment was designed as a two factor full factorial design without replications. The reason for choosing this design actually became obvious while conducting profiling studies and collecting data. It was seen that the CPU time of execution of functions varied from type of function to function and also by varying workload. Thus we had a situation where two sets of parameters were affecting the CPU time. A careful control of the two sets of parameters i.e. Functions (host creation, Polling and Sleep) and Workloads (users and the number of hosts) was required. It was considered appropriate to compare the effect of selected functions and workloads on the CPU times. We assumed that factors are categorical. A full factorial design with two factors Functions (Aj) and (Bi) having 3 levels each required 9 experiments. The results are deterministic in nature and single experiments were taken into account.
There is no simple way of collecting behavioral data for a complex control and management platform like OpenADN. It called for deterministic profiling described in Section 3 to be carried out. The method and data collected is given in Section 5.
Following the discussion in section 3, it was considered appropriate to use deterministic and concurrent techniques for collecting execution data for carrying out the experimental study:
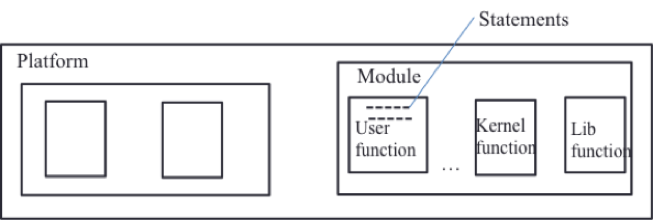
Figure 4. The Layered Profiling Model
Platform level profiling provided overall execution data for the complete platform. However, this does not tell us where the hotspots are. Function level profiling gave the CPU times for execution of various functions so that we could isolate the functions taken disproportionate time to execute. While this gives us information like which function is taking more time, it does not tell as the exact location of these time consuming operations. Thus the statement level profiling was carried out to get the location of the calls that were resulting in inappropriate behavior. The layered profiling model is shown in Figure 4.
The experimental setup consisted of one global controller, resources from two datacenters with one local controller each, a distributed dataplane with 7 hosts per local controller and a nameserver all on virtual machines. A client node was also created to simulate different number of users. The setup is shown in Figure 5.
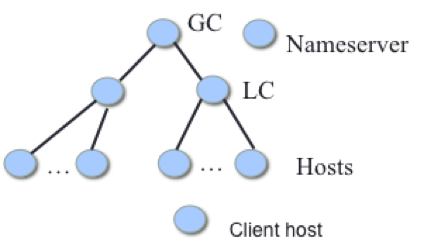
Figure 5. Virtual Resources Used For Experiments
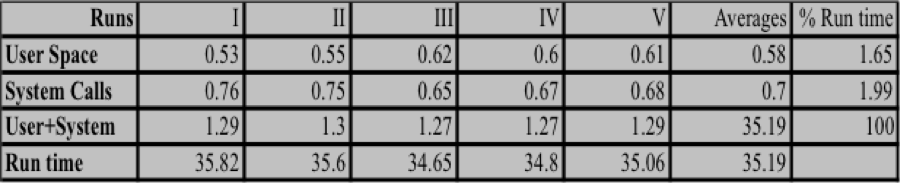
Platform level analysis: To get the broad idea of the efficiency of the platform code executing in a virtualized environment, the Unix time utility was used. Table I shows the CPU times for user space functions, kernel functions and the total run time of the platform. Data from seven runs are given in the table
Table I Platform Level Execution Data
Graphical representation of the data is given Figure 6.
Figure 6 User, System and Overall CPU TIme for OpenADN
Of the average total elapsed time of 49.27 seconds for which the platform software was executed, the time spent in user functions and kernel space was 2.65% and 3.60%, respectively. This gives a sense that a large part of the time is spent in I/O waits and sleep times for dealing with dependent asynchronous concurrent processes. However, it cannot be yet said whether this time relates to unavoidable delays and the situation can be improved through optimization. This called for the next level of profiling, i.e., at module/function level to see which of the modules are more CPU intensive.
Function Level Profiling and Analysis: Deterministic profiling of OpenADN programs was carried out to see execution pattern and the resultant CPU loads of various functions. This was done through cProfile provided by the Python library. The profile of these programs gives a set of statistics that describes how many times different functions are called and how much time the CPU is spending in various modules. The module ‘pstats’ [python09] was used to format these statistics to make them amenable to analysis. A large volume of data was produced of which a part of output is given in Figure 7.
Figure 7. Extract of Function Level Profile
It can be seen that the platform was executed in the run above for a total of 59.801 seconds. Out of this the polling function took 42.045 seconds. The polling function is used from the ZeroMQ library [zeromq15] and is used for communication between service modules on different virtual hosts. The communicating services have to poll the sockets to see if any message has arrived. If a large amount of time is taken then this may be an indication that the entire process of platform execution may be slowing down. To know the exact location of this time consuming operation and other such operations statement level profiling was done.
Statement Level Profiling: As is often the case, the reason for a particular module or functionality taking a large amount of time could be pin-pointed to some small part which may seem to be innocuous on simple reading of the code. Some statements could trigger a library function or call to a special method that may not be so obvious. A more detailed line-by-line analysis of the program was undertaken to find out which parts of the program take more CPU time. The Kernprof python script and the @profile decorator used in a judicious manner allow this kind of analysis [kern15]. Workload (creation of number of hosts) was varied to get CPU times various statements and identify the functions that should be taken up for further analysis. Figure 8 shows a section of the profiling output with a large proportion of sleep time (92%) and also the time taken for creation of hosts.
Figure 8. Extract of Statement Level Profile (Sleep) 2000/4"
Figure 9 shows that, in this section of the profile, the polling function takes 78.7% of the time. Legends of Figure 8 are applicable.
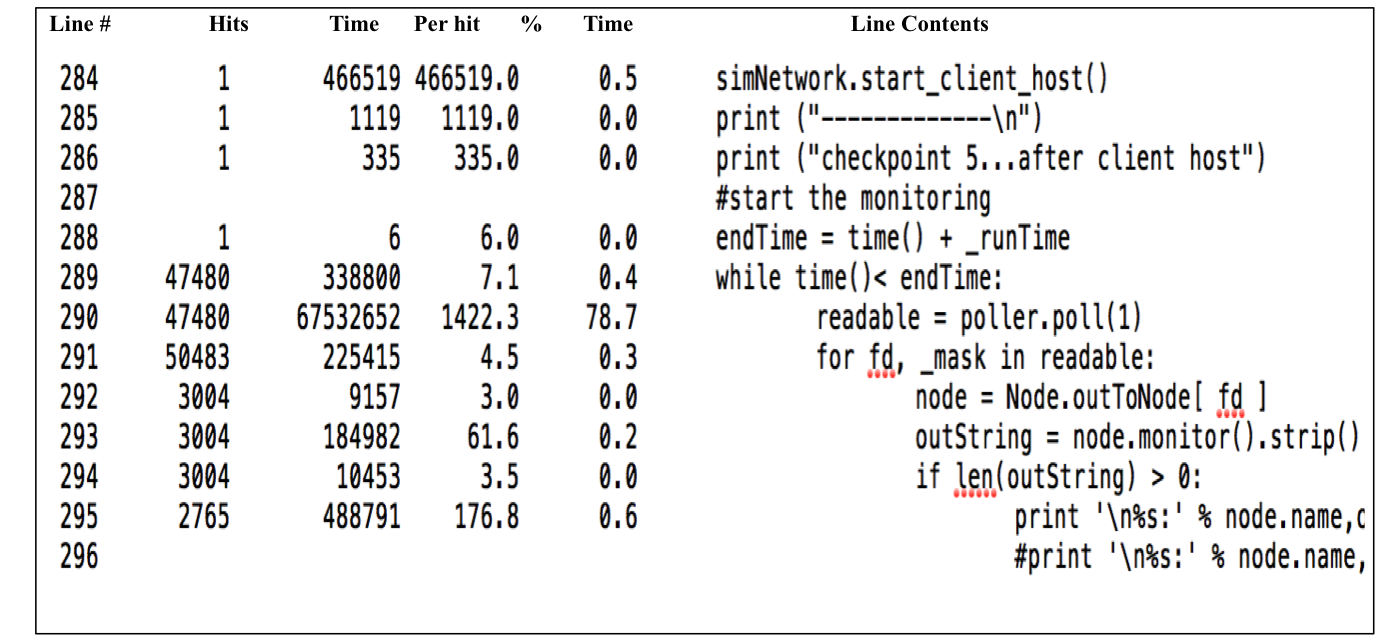
Figure 9. Extract of Statement Level Profile(Poller) 2000/4
Fig. 10 shows 68.9% of the CPU time taken by host creation and linking. Legends of Figure 8 are applicable
Figure 10. Extract of profile for 2000/8 hosts showing 68.9% host creation and linking time"
While the recursive function level profiling that includes timing of execution of sub-functions and statement level profiling include the effect of execution of various threads, the interaction may not be evident. To get a better understanding of the multi-threaded platform, thread level profiling was carried out while the program was in execution. A sample of concurrency profile is given in Figure 11. This aspect of profiling is part of future work.
Figure 11 Concurrency Profiling with 2000 users and 16 hosts
Figure 11. Concurrency Profiling with 200 users and 16 hosts
From all the profiling runs with different workloads it was seen that three types of activities are consuming a large amount of time during the execution of the platform software:
The percentage time consumed by these functions varied with the workload. The workload was varied by varying the number of users from 500 to 2000 and also by creating hosts per cloud varying from 4 to 16. It was seen from the measurements taken that the CPU time across functions varied more with the number of hosts created than with the number of users. It was, therefore, decided to carry out a detailed performance analysis for 2000 users and the number of hosts varying from 4 to 16 in steps of 4.
As noted in Subsection 4.3, a two factor full factorial design with CPU time (the observed function time rationalized with total module execution time) being observed and the factors as FUNCTIONS and WORKLOAD was used (Table II). The following table gives the CPU times for these factors. The CPU time observed for execution of the three functions has been rationalized with the total module times to make them comparable.
Table II CPU Time for Functions and Workloads
Table III gives the calculation of row (workload) and column (Functions) effect. The grand mean is 0.7001. From the table it is seen that the effect of host creation is 38.57% less than the average CPU time while that of Polling and Sleep are 7.66% and 31.35% more. The workload effects are small and within 1% of average workload either way.
Calculation of Effects of Functions and WorkloadsTable III Calculations of Effects of Functions and Workloads
The total variation of y (CPU time) can be attributed to two factors: Functions and Workloads and to the experimental errors. We use the equations SSY=SS0+SSA+SSB+SSE and SST=SSY-SSO to calculate the values of these factors. The calculated values are given in table IV.
The percentage variation explained by the functions is 100xSSA/SST = 100x0.2748/0.4024=68.29%
The percentage variation explained by the workloads is 100xSSB/SST=100x0.0002/0.4024= 0.05%
The unexplained variation is 100xSSE/SST=100x0.1275/0.4024=31.68%
From the above we conclude that the workloads are not important in the process of optimizing CPU resources but the functions selected are important for optimization.
Table IV Table of Sum of Squares
Table V Table of Sum of ANOVA Table for Functions and Workloads
The workloads had comparable runtimes. This ensured that effect of the functions selected is not overshadowed by the differences in the workload run times. The F-ratio calculated for Functions is greater than that obtained from the table so they are significant for our study. F Level of workload is less so they are not significant
Visual examination of residuals and response can be seen from the graphs below. In order to check the homogeneity of the error variance we obtain errors (Table VI) and plot them against predicted response
Table VI The estimated y and Residuals
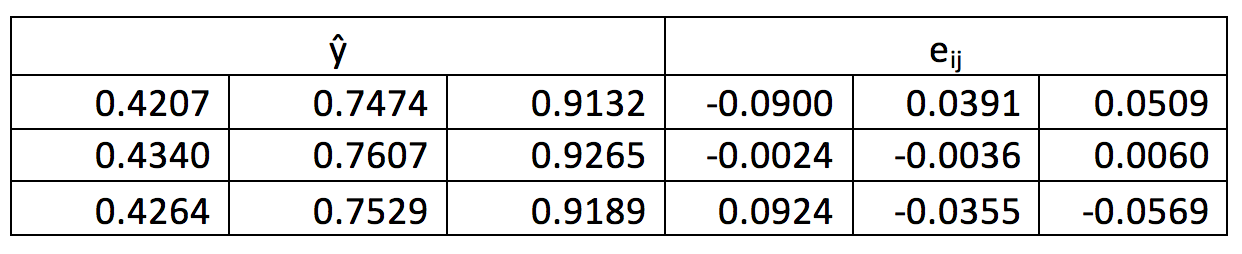
The plot of residuals and responses are Figure 12a. It can be seen that the spread of the residual is small and shows no trend. A normal quartile-quartile plot was plotted and is shown in Figure 12b. The errors are small and add upto zero. The plot is approximately linear.
Figure 12a. Residual Response vs Predicted Response
Figure 12b. Normal vs Residual Quantile
To check the sanity of our results took the analysis further by calculating 90% confidence intervals for the effects related to functions and workloads (Table VII). The t value used for the calculations of CI are for 90% confidence interval and 4 degrees of freedom
Table VII Calculation of CI of Effects
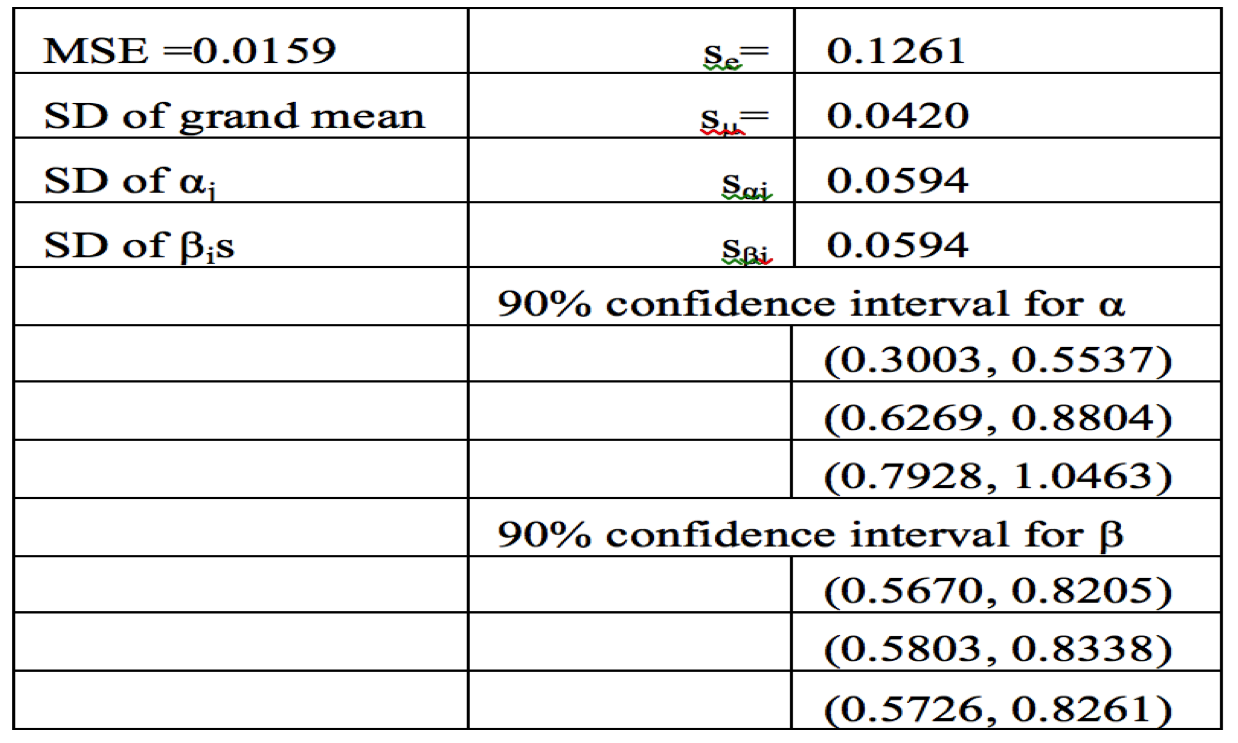
In case of functions we see that none of the intervals has 0 in the range so they are all significant. Also the mean of one α is out of the CI of the other two so they are not similar to each other do not have same effect on the study and each need to be studied. The workloads on the other hand have their means in the CI of the others so they are similar to each other.
To summarize, it can be said that in performance evaluation of a complex multi-threaded and distributed OpenADN software, the profiling data obtained through deterministic methods coupled with the two factor full factorial design to determine whether the factors selected are significant and should be used for further optimization of OpenADN platform. The factors viz. Functions (host creation time, polling and sleep times) and Workloads (2000 users with 4, 8 and 16 hosts) were selected based on the various levels of profiling data collected. Workloads did not turn out to be useful for optimization and their effect was low and indistinguishable. After a detailed analysis we have reached the conclusion that all the functions are significant and they have a large effect on the CPU time of the platform. These functions can therefore be taken up for optimization. Thus, data gathering through layered profiling and full factorial analysis of the data can reveal vital information about for optimization.
| ADN | Application Delivery Network |
| CPU | Central Processing Unit |
| CSP | Cloud Service Provider |
| EC2 | Elastic Cloud 2 |
| GC | Global Controller |
| I/O | Input-Output |
| ID | Identity |
| IDC | International Data Corporation |
| IPC | Inter Process Communication |
| ISP | Internet Service Provider |
| LC | Local Controller |
| NSP | Network Service Provider |
| OpenADN | Open Application Delivery Network |
| SS | Sum of Squares |
| SSH | Secure Shell |
| VM | Virtual Machine |
| WAN | Wide Area Network |