| Meenal Kulkarni, mkulkarn@wustl.edu (A paper written under the guidance of Prof. Raj Jain) |
Download |
Keywords: Spectropolarimetric imaging, spectrometry, polarimetry, image sensors, polarization imaging, performance evaluation, spectral-polarization imaging workloads, simulations, measurement, optical characterization, benchmark
Polarimetric (or polarization) imaging, the imaging of light's polarization property, is commonly used to detect structural and shape data in a scene. Polarization describes the orientation of the plane of oscillation of light waves. The human eye is blind to polarization, which provides visual information entirely unrelated to spectral (color) as well as intensity (brightness) information. Polarimetric imaging involves the use of optical elements, such as polarization filters, optical retarders, lenses and image sensors (also known as focal plane arrays or FPAs) in order to capture human-viewable images.
A recent drive in polarimetric imaging research is to incorporate spectral detection in a scene. The range of the electromagnetic (EM) spectrum that is visible to humans has wavelengths of 400 nm (blue light) to 700 nm (red light). Spectropolarimetric imaging aims to acquire the polarization parameters for different wavelengths of light, such as for the visible, ultraviolet and/or infrared bands of the EM spectrum. Knowing the spectral properties of objects is immensely useful, and is often used in the material detection of objects. For instance, hyperspectral imaging in remote sensing has applications in agriculture, meteorology, and remote surveillance. The combined polarization and spectral knowledge of a scene vastly broadens the capability of the human visual system. For example, the SPEX spectropolarimeter [Voors2010] captures fine-grain spectral and polarization information to obtain the physical composition of planetary atmospheres.
With the promise of applications in medicine [Liua2012], astronomy [Voors2010] and remote sensing [Wang2009] various spectropolarimetric imaging systems have been reported in the literature. This paper surveys various types of spectropolarimetric imaging systems and describes commonly employed performance characterization techniques. Section 2 describes different spectropolarimetric imaging systems from the literature. Performance metrics and evaluation techniques for these systems are discussed in Sections 3. Section 4 discusses common pitfalls and mistakes in the evaluation of these systems and Section 5 offers recommendations to make the characterization more correct and comprehensive.
The following subsection provides a brief mathematical background, which is necessary to understand the aspects of polarization imaging discussed in this paper.
A polarization imaging system seeks to acquire polarization parameters, known as the Stokes' parameters. Stokes' parameters are calculated from the intensity received through linear polarization filters at different orientations. Linear polarization filters filter the incoming light such that only the light oscillating along the axis of the polarization filter passes through and all other light is blocked. The intensity of the transmitted polarized light is captured by an image sensor array, i.e. it is time averaged according to the exposure time setting, and output as a digital value.
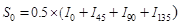
The Stokes' parameters, S0 through S2, are calculated as shown in equations (1.1)-(1.3) [Goldstein2003]. These parameters enable the perception of linearly polarized light. are the intensities through polarization filters oriented at 0, 45, 90 and 135 degrees respectively. Therefore, one way of fully measuring linear polarization is using four such polarization filters. Such a system is also called a 3-dimensional or partial-Stokes system [Tyo2006].
There is another parameter, S3, which is used to measure circular polarization. S3 is calculated as shown in equation (1.4) [Goldstein2003]:
In order to perceive S3, it is necessary to use a quarter-wave plate in conjunction with a linear polarization filter. Such a system is also called a full-Stokes measurement system [Tyo2006].
For the human viewer, polarization in a scene is depicted in terms of the Angle of Polarization (AoP), and the Degree of Polarization (DoP) for a full Stokes system, and Degree of Linear Polarization (DoLP) for a 3-dimensional system. In terms of light waves, AoP is thought of as the orientation of the plane which the light waves oscillate. DoP describes what portion of the light waves is polarized: it can be thought of as the amount of polarization. Both of these parameters give viewers clues on the shape and structure in the scene.
For any spectropolarimetric imaging system, the aim is to find the Stokes' parameters as a function of the wavelength of light. This means that the system should be sensitive to both the wavelength of the incoming light as well as its polarization. Various optical systems have been designed to achieve this. The following section describes several such spectropolarimetric imaging systems from the literature.
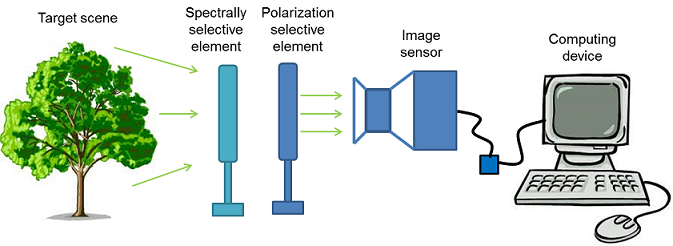
A number of spectropolarimetric imaging systems have been reported in the literature. These sensors vary in terms of their design, but typically contain a spectrally selective element, a polarization selective element, and an image sensor, as shown in Figure 1. Considerations in the design of such a system include: target applications, targeted range of the EM spectrum, desired spectral resolution, polarization detection capabilities (full or partial Stokes), size of the setup, computational requirements, moving parts, and focal plane array design. In the following subsections, we discuss spectropolarimetric sensors with diverse architectures.
Division-of-time (DoT) spectropolarimetric systems combine a spectral filter with a conventional polarimeter. Spectral filters filter the incoming light so that only a specific narrow band of wavelengths is output from the filter. In DoT systems, the filter is changed or tuned in some way, and an image is captured at these different time points. A very simple application is to use a spectral filter wheel in conjunction with a polarimeter [Tyo2006]. The wheel is rotated and the polarization of light for each wavelength band captured; that is, an image is stored for every change of the wheel. The process is slow and requires the imaged scene to be static, as any movements will cause motion blur issues [Tyo2006]. In order to speed up this image acquisition process, high-tech tunable spectral filters are used. We discuss these in the following subsections.
Liquid Crystal Tunable Filters (LCTFs) are tunable, that is, they can be set to transmit light of only a selected polarization direction and of a particular wavelength [Shingu2003]. Following that, a lens focuses the light onto an imaging array, such as a CCD sensor. In this way, a spectropolarimetric image is captured. The filters can be tuned at a speed on the order of milliseconds. Acousto-Optic Tunable Filters (AOTFs) speeds this up to microseconds.
Acousto-Optic Tunable Filters (AOTF) are also used in the DoT paradigm [Gupta2002]. In the case of the AOTF system detailed in [Gupta2002], a tellurium oxide based AOTF is the spectral selection element and a liquid crystal variable retarder, similar to the LCTF, acts as the polarization selection element. The AOTF works as follows: a radio frequency (RF) is applied to a crystal, which turns into a spectrally selective element known as a diffraction grating. The incoming light hits this diffraction grating and gets split into its component wavelengths. The diffracted beam has a certain center wavelength, which is output by the filter. The wavelength of the beam can be tuned in microseconds, by changing the frequency of the RF wave.
Photo Elastic Modulators (PEMs) are tunable polarization elements that allow for highly sensitive polarization measurements. In [Wang2009], the spectrally selective element is a diffraction grating, and the polarization selective element is a PEM. The photodetector (image sensor) is an extremely sensitive photomultiplier tube, which captures both the average light intensity and the polarization parameters. This system is a full-Stokes system. The circular polarization component was shown to successfully image foliage in a remote sensing application.
Although the process of spectrum and polarization acquisition speeds up in the cases described above, DoT spectropolarimeters still do not capture them simultaneously, or in a snapshot. This is far preferable as it avoids the problem of motion blur artifacts. The following subsections discuss some sensors that enable snapshot spectropolarimetric detection.
A Computed Tomography Imaging Channeled Spectrometer (CTICS) is described in [Vandervlugt2008]. The system borrows ideas from computed tomography, imaging spectrometry and channeled polarimetry [Oka2011]. This system uses an optical setup consisting of an objective lens, a field stop, a collimating lens, a dispersive diffraction grating, quarter-wave retarders, a linear polarizer and a reimaging lens to capture a 4D "data cube" comprising spectral and polarization information. The polarization information is modulated onto the spectrum captured by an image sensor array, analogous to amplitude modulation [Goldstein2003]. The polarization and spectrum are reconstructed using methods from computed tomography.
The CTICS system is the first foray into perceiving the spectral and polarization content of light simultaneously. This work was extended in [Sabatke2001] and [Kebabian2004] and similar systems have also been realized, which modulate the Stokes' parameters [Kebabian2004] or the AoP and DoLP [Voors2010] onto the radiance spectrum. Fourier transform spectropolarimeters use a similar modulation/demodulation process (examples are [Tyo1999] and [Jie2011]). The drawback in this type of system is the tradeoff between spectral and spatial resolution, computational requirements, and bulky optical setup. The next section discusses a type of snapshot sensor, which is compact in comparison to channeled spectropolarimetric imaging systems.
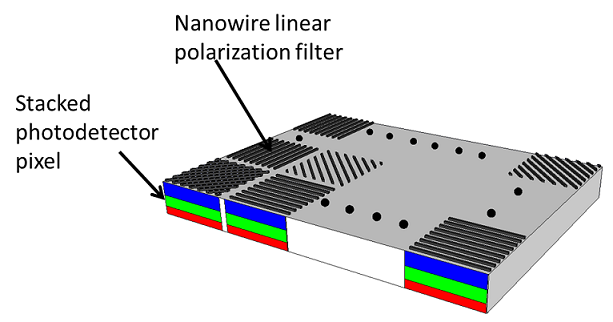
Division-of-focal-plane polarization (DoFP) imaging sensors integrate CMOS or CCD image sensors with pixel-size-matched aluminum nanowire linear polarization filters. These sensors capture the polarization properties in the visible and/or IR spectrum of light, depending on the spectral sensitivity of the filters and the FPA. A DoFP polarization sensor has recently been reported [Gruev2012], which also has spectral capabilities. This novel sensor uses vertically stacked photodetectors; each of the three stacked junctions leads to a different spectral sensitivity. See Figure 2 for a simple diagram of this sensor.
The advantage of this sort of sensor is that it is compact and allows for the real-time detection of spectral and polarization information. This information is received, requires very little processing, and displayed as an image. However, some aspects of this sensor's design are challenging, such as defining its spectral resolution and processing the color to make it more accurate for the human visual system.
Note: there are upcoming possibilities in spectropolarimetric imaging, such as plasmonic photon sorters (described in [Ebbesen2008] and [Xu2010]), which we do not discuss in this paper. However, the performance evaluation ideas presented here can be borrowed for other such systems. Having discussed various types of spectropolarimetric imaging systems, in the next section we proceed to consider various performance metrics for these systems.
There are three main aspects in the evaluation of a spectropolarimetric imaging system: its spectral measurement capabilities, its polarimetric capabilities, and the properties of the focal plane array. Each of these aspects has associated performance metrics. In the following sections, we describe the main metrics used for evaluating the performance of these systems.
Polarimetric characterization of the sensor is important to understand the quality of polarization reconstruction by the spectropolarimetric imaging system. It can help determine if the instrument needs to be calibrated and whether to expect polarization-related artifacts in the image produced by the system. The main aspects that are tested are the errors in polarimetric reconstruction, and the quality of the polarization element(s) in terms of the extinction ratio.
The Stokes polarization parameters described in Section 1.1 are the output, as a function of the detected wavelength, from any spectropolarimetric imaging system. A typical concern for such a system is how well the polarization detection works and how accurately the Stokes' parameters are reproduced by the system. The workload used may be a polarized narrowband LED [Vandervlugt2008], or an input spectrum, modulated by Stokes' vectors (used for system simulation in [Voors2010]), as well as measurement [Jie2011], or a uniform polarized flat field of a narrow wavelength band [York2012]. In all of these cases, the input Stokes' parameters are known, and the output Stokes' parameters are calculated. The accuracy of reconstruction is typically quantified by a root mean squared error (RMSE) metric. This is an LB metric.
The AoP and the DoLP are both calculated from the input Stokes' parameters [Goldstein2003] and therefore error in the Stokes' parameters propagates to the AoP and DoLP. A way to establish this error has not been defined as far as we know; however, experiments are usually devised similar to that described above, where the workload is uniform illumination of a known AoP [York2012] or DoLP [Gruev2012] and the measured output is compared to the input, and results typically provided in terms of RMSE (LB metric).
The extinction ratio is an important metric for polarizers and is extended to spectropolarimetric imaging systems as well. The extinction ratio is the ratio of the maximum polarization response of a polarizer to its minimum polarization response. The extinction ratio is an HB metric, and the ideal extinction ratio is infinity. The higher the extinction ratio, the better the system can discern between different degrees of polarization.
Extinction ratio should ideally be independent of the characteristics of the focal plane array and the intensity of the incoming light. Extinction ratio is typically dependent on the wavelength of the incoming light in DoFP sensors, because of the spectral response of the polarization filters. [York2012] describes a method to calculate extinction ratios for DoFP polarization sensors and [Gruev2012] extends this method to spectral-polarization sensors.
In the following subsection, we describe spectral performance metrics.
The spectral performance of a spectropolarimetric system is characterized in terms of many different metrics. These metrics may be dependent on both the focal plane array as well as the spectral elements in the optical setup. The spectral range of the system tells us for what range of the EM spectrum the system is functional. This is typically known and depends on the FPA. For instance, spectropolarimeters exist for the near-UV, visible and IR spectral ranges.
The spectral sensitivity is characterized in terms of the quantum efficiency (QE). QE is a ratio, which effectively gives the detected intensity for different wavelengths of light. QE is an HB metric for the relevant wavelength band. For example, if the FPA pixels are supposed to be sensitive to light in the 400 nm - 420 nm wavelength range, the QE for that range should be high and for any other wavelengths should be low. A typical workload for finding QE is extremely narrowband, uniform, unpolarized light. The wavelength of the light is swept, typically using an instrument such as a monochromator, and the registered intensity is noted [Gruev2012]
.The spectral resolution of a spectropolarimetric imaging system defines how well the system can discern between light of different wavelengths. An instrument with a spectral resolution of 2 nm means that it will be able to distinguish between wavelengths 2 nm apart. Ideally the spectral resolution should be very fine; thus, it is an LB metric. [Shingu2003] and [Shingu2004] define spectral resolution as the full-width half-maximum (FWHM) of the measured raw data. When the workload, a helium-neon gas laser light of wavelength 632.8 nm strikes the sensor, which uses an LCTF, the spectral resolution of the sensor is found to be less than 10 nm at that wavelength. Spectral resolution is also found to be varying with the incident wavelength and has to be separately measured. This is true in the case of both the LCTF and the AOTF spectropolarimeters.
Essential to spectropolarimetric imaging systems are image sensors, or focal plane arrays (FPAs). These have specific related properties, such as linearity and spatial resolution (i.e. number of pixels). These are discussed in the following subsection.
The image sensor, or focal plane array, used in spectropolarimetric imaging systems has many important properties, which decide the ultimate image viewed by the user. Often, the FPA used in these systems is an off-the-shelf component. The performance metrics are then provided in the specification for the FPA and it is unnecessary to carry out evaluation tests. However, the metrics are still useful to understand and therefore described here [Nakamura2006].
Signal-to-noise ratio (SNR) is an HB metric, which describes the relative amount of useful data in the image to the noise in the image. We typically calculate SNR by taking numerous image samples over time and dividing the mean of the response across the FPA (averaging across all the pixels) by the standard deviation. In [Gruev2012], the workload used for SNR measurement is a 550 nm flat field of known intensity. The best SNR is found to be 45 dB. This is a typical number for most CMOS image sensors.
Linearity is an HB metric. Linearity refers to the relationship between the incident light intensity and the light intensity as reported by the sensor (as a digital value). It is important to note that the linearity of a spectropolarimetric imaging system is entirely unrelated to the linear polarization of light. In [Gruev2012], the linearity of the FPA is analyzed by varying the incident light intensity, measuring the digital value output and fitting a linear regression model. Residuals are also calculated and found to be minimal.
Spatial resolution is an important factor for FPAs. In common terminology, it is the number of pixels in the image sensor. In the case of the CTICS system described earlier, the spatial resolution also determines the spectral resolution. The more pixels on the CTICS FPA, the more room there is to disperse the spectral data cube; therefore, there is a direct relationship between the total spatial resolution and the spectral resolution of the sensor. It is typically an HB metric.
Temporal resolution, otherwise known as the frame rate, is also related to the spatial resolution, as well as many other factors, such as the transfer speed between the sensor and the computing device or memory. Temporal resolution is how many image frames are captured in each second. It is an HB metric for snapshot systems. It is a "don't care" for DoT systems, as long as it is higher than the rate at which the filters are changed or tuned.
Next, we enumerate the factors varied in spectropolarimetric imaging workloads.
In Sections 3.1-3.3, we discussed numerous metrics associated with spectropolarimetric imaging systems, along with various workloads used in system characterization. It is helpful for the remainder of this paper to enumerate the important factors related to this characterization. Factors are the variables or parameters that affect system response and can be used to characterize system response. Factors can be internal variables or external stimuli. Typical factors for spectropolarimetric imaging systems are:
A spectropolarimetric imaging system is complex and there are numerous features to consider in its evaluation. In the literature, we have seen examples of both performance evaluation techniques: simulation ([Voors2010], [Jie2011], [Sabatke2001]) and measurement (various references). In this section, we consider some issues in the performance analysis of spectropolarimetric imaging systems.
Before physically building it, a complex spectropolarimetric imaging system is often first modeled, and the model is simulated with input stimuli. An important modeling consideration is to avoid any extraneous parameters; at the same time, it is important to consider physical parameters that are likely to affect the system. For instance, the authors of the CTICS system demonstrate careful system modeling in [Sabatke2001] by ensuring that they include any imperfections in the optical elements in the system model. Typically, the optical elements are modeled using appropriate Mueller matrices for each component, as in [Voors2010]. The risk with this type of model is that physical non-idealities are not incorporated into the model; therefore the results obtained through simulation can be far superior to those in actuality.
A model may be developed for a system, but in order to be meaningful, it must be tested for correctness and goodness. The difference between the measurements at each point and the model (i.e. modeling error or residuals) should be normally distributed. The presence of normally distributed errors means that the errors are indeed random; non-normally distributed errors mean that the model needs refining, or incorrect conclusions may be drawn from it. Other ways to test the accuracy of the model are by calculating its coefficient of determination, by ensuring that the errors are at least an order of magnitude smaller than the measured quantity, and by calculating the confidence intervals of the regression parameters [Jain1991].
It is difficult to compare the performance of spectropolarimetric imaging systems because while the performance metrics are similar (e.g. extinction ratios, RMS error in reconstruction of polarization parameters), the workloads used for various systems vary greatly. Refer to Section 3, where we discussed several different workloads used across the literature to gauge the system performance for the same metrics. Inconsistent workload apart, one immediate concern is that the workload chosen should not in any way favor the system under test. In other words, the workload should explain very little of the overall variation [Jain1991].
In addition, occasionally various workloads are used to measure or prove a single parameter. For example, [Vandervlugt2008] uses a linear sheet polarizer, a broadband point source, color LEDs, diffuse illumination as well as real-life images to demonstrate the quality of reconstruction of the Stokes' parameters as a function of the spectrum. This is a useful way to convince the reader of the versatility of the system. However, if the research community were to develop a single "benchmark" (as commonly used in the performance analysis of computer systems), this would be a valuable, objective way to compare various systems. In Section 5.2, we present a possible benchmark.
A common pitfall seen across the literature is that the experiments to determine various performance metrics are either replicated not at all or too few times. Sometimes, the number of replications is not specified at all. This leads to qualitative reporting of errors (e.g. using statements like "The measured DoLP was in very good agreement with the incident DoLP" [Voors2010]) and unspecified confidence intervals for measured values. Having a number of replications is beneficial as it reduces the standard deviation, bringing the acquired result closer to the population mean [Jain1991]. Section 5.1 expounds further on the importance of replicating experiments.
Performance evaluation experiments are commonly designed with simple one-factor variation. For example, system response is measured when only the incident angle of polarization is varied, only the incident light intensity is varied, or only the incident light wavelength is varied; all other factors remain constant. Such simple experimental design is suitable for systems where there is no interaction between factors [Jain1991]. However, because of the physical attributes of the optical elements and FPA in spectropolarimetric imaging systems, it is very likely that there are strong interactions between factors; therefore, a fractional factorial design or at least a 2k or 2kr factorial design is more appropriate [Jain1991]. Section 5.2 delves in to more detail regarding this.
Next, we briefly take note of issues in data presentation.
Spectropolarimetric systems measure data with multiple dimensions. Therefore, presentation of these results is often challenging. It is important to keep the ease of the reader in mind when presenting data. Common issues in data presentation are: very small font size, missing scales and/or units, unspecified confidence intervals, unspecified error bars, use of symbols rather than words, unclear or missing descriptions of figures and too many curves on a plot. Adopting recommendations in books such as [Jain1991] and [Tufte2001] for data presentation may be helpful to both the author and the reader.
Section 5 follows up with recommendations on how to avoid inaccuracies in the performance analysis of spectropolarimetric systems; specifically, it addresses the issues described in this section.
In this section, we propose recommendations that we believe would benefit the spectropolarimetric research community and the optics community in general. Adopting these will help overcome the performance characterization issues detailed in Section 4. Section 5.1 follows with overall recommendations. Section 5.2 proposes a benchmark that can be adapted for experimental design.
We have the following overall recommendations for the thorough and correct analysis of spectropolarimetric imaging systems:
Applying the above recommendations should result in a more systematic and accurate characterization of spectropolarimetric imaging systems. The following section discusses a possible optical benchmark for spectropolarimetric imaging systems.
Workloads should not be tailored to the system and should remain "secondary factors", i.e. they should have minimal effect on system performance. Pre-defined, universal workloads (known as "benchmarks") have been proven beneficial in computer system performance analysis. Qualities of a good benchmark are: portability between different systems, lack of bias (does not favor a particular system), completeness, measurability and repeatability. In this section, we extend the benefits of benchmarking to spectropolarimetric imaging systems by introducing such a benchmark for their performance analysis. A good benchmark would enable the objective comparison of spectropolarimetric imaging systems.
As mentioned previously, in most optical experiments, inter-factor interaction is neglected. However, exposing these interactions helps us understand precisely what constitutes the system response. For instance, in a DoFP system, it is interesting to know how much of the system's polarization measurement capability is explained by the wavelength of the incident light and how much by the extinction ratio of the nanowire polarization filters. In statistical terms, this would be the "percentage of variation" as found in an Analysis of Variance (ANOVA). The benchmark proposed in this paper includes testing for inter-factor interaction.
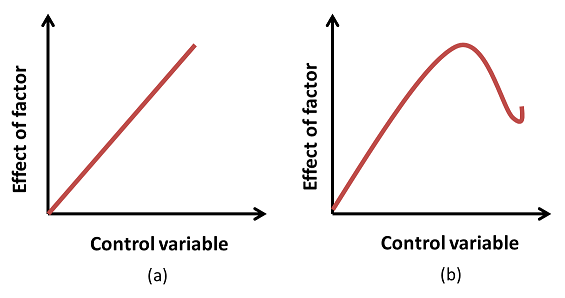
In the design of a performance characterization experiment, two stages are recommended. In the first stage, a simpler design can be used where only two levels of each factor are tested. (Factors are discussed in Section 3.4.) In order to use only 2 levels of the factors, it is important that the factor have a unidirectional effect on the system response (see Figure 3). This is true for the four factors mentioned in Section 3.4. The levels chosen are on opposite sides of the measured range of the control variable. For instance, the working assumption is that extinction ratio should increase as the incident wavelength changes from 400 - 700 nm.
The effects, or importance, of the factors, are then calculated. This is known as a 2kr design, where k is the total number of factors and r is the number of times the experiment is replicated. In Section 3.4 we found that k = 4. This means that a total of 16 experiments would be needed in order to fully understand the performance of a spectropolarimetric imaging system. These 16 experiments form a benchmark. Figure 4 shows this design for the four factors enumerated in Section 3.4, and two levels for each factor (the levels are designated as -1 and 1).
The factors and their levels are:
At this initial stage at least few replications (~10) are recommended to remove noise and ensure that the statistical significance of the factors is properly measured. The experimental design shown in Figure 4 can be analyzed using techniques shown in [Jain1991] to reveal all the inter-factor interactions. If 16 experiments are not possible, a 2k-pr factorial experimental design can be employed with p = 1 instead, leading to 8 experiments. A confounding of I = ABC, or anything similar, can be chosen. At least 8 experiments are required as there are four effects to measure. A minimum of 10 replications is recommended.
After an ANOVA analysis, the various factors can now be ordered in terms of their significance. In the second stage of the experimental design, a more detailed analysis can now be undertaken, where more levels of the significant factors are exercised. The factors have numerous possible levels (in fact, many of the factors are technically continuous in nature). Therefore, a fractional factorial design with at least 25 replications has been recommended below. The new set of levels is then (choose the significant factors):
For all of the experiments described in this section, a uniform flat field of illumination is recommended. This can be produced using an integrating sphere and a collimating lens [York2012]. No physical objects should be used as workload for determining quality of reconstruction as this raises questions of bias in the workload. It is recommended that physical objects be used when demonstrating other qualities of the spectropolarimetric imaging system, such as spatial resolution or final image produced.
The benchmark described in this section enables the systematic testing of any spectropolarimetric system. Inter-factor interactions are taken into account, and the workload is not biased. Next, we conclude with a summary.
Spectropolarimetric imaging has extremely useful and diverse applications. The systems used for these applications are required to be thoroughly evaluated and characterized. In this paper, we surveyed numerous spectropolarimetric imaging systems and techniques for their characterization. We explored the main performance metrics of interest and some commonly used experimental workloads. We found that across the literature there is a need to refine the performance evaluation of these systems and to do this by incorporating simple, but powerful, statistical analysis techniques. Therefore, we gave numerous recommendations and proposed a comprehensive benchmark that, if adopted, can benefit the research community. Future work will consist of a case study to demonstrate the usefulness and ease of adaption of the spectropolarimetric evaluation benchmark.
References in order of importance:
[Jain1991] R. Jain, The art of computer systems performance analysis. Vol. 182. Chichester: John Wiley & Sons, 1991.
[Tyo2006] J. Scott Tyo et al, "Review of passive imaging polarimetry for remote sensing applications." Applied Optics 45.22 (2006): 5453-5469. Available at http://www.opticsinfobase.org/ao/abstract.cfm?id=90874
[Goldstein2003] D.H. Goldstein, Polarized Light, 3rd Edition. CRC Press, 2003.
[Gruev2012] M. Kulkarni et al, "Integrated spectral-polarization imaging sensor with aluminum nanowire polarization filters." Optics Express 20.21 (2012): 22997-23012. Available at http://www.opticsinfobase.org/oe/abstract.cfm?uri=oe-20-21-22997
[York2012] T. York et al. "Characterization of a visible spectrum division-of-focal-plane polarimeter." Applied Optics 51.22 (2012): 5392-5400. Available at http://www.opticsinfobase.org/ao/abstract.cfm?uri=ao-51-22-5392
[Vandervlugt2008] C. Vandervlugt et al, "Computed tomographic imaging spectropolarimeter characterization." Optical Engineering + Applications. International Society for Optics and Photonics, 2008. Available at http://proceedings.spiedigitallibrary.org/proceeding.aspx?articleid=795274
[Nakamura2006] J. Nakamura, Image sensors and signal processing for digital still cameras. CRC Press, 2006.
[Voors2011] R. Voors et al, "Prototyping for the Spectropolarimeter for Planetary EXploration (SPEX): calibration and sky measurements." SPIE Optical Engineering+ Applications. International Society for Optics and Photonics, 2011. Available at http://proceedings.spiedigitallibrary.org/proceeding.aspx?articleid=1342723
[Wang2009] B. Wang, et al, "A spectroscopic polarimeter for detecting chiral signatures in astrobiological samples." SPIE Optical Engineering+ Applications. International Society for Optics and Photonics, 2009. Available at http://proceedings.spiedigitallibrary.org/proceeding.aspx?articleid=786463
[Shingu2003] H. Shingu, et al, "Earth observation system incorporating an LCTF spectropolarimeter." Proceedings of SPIE. Vol. 4881. 2003. Available at http://ebooks.spiedigitallibrary.org/data/Conferences/SPIEP/30158/503_1.pdf
[Shingu2004] H. Shingu, et al, "Development of an imaging spectropolarimeter using a liquid crystal tunable filter." PROCEEDINGS OF THE INTERNATIONAL SYMPOSIUM ON SPACE TECHNOLOGY AND SCIENCE. Vol. 23. No. 2. 2002. Available at http://airex.tksc.jaxa.jp/dr/prc/japan/contents/NALRP2002029/nalrp2002029.pdf
[Gupta2002] N. Gupta et al, "Acousto-optic tunable filter based visible-to near-infrared spectropolarimetric imager." Optical Engineering 41.5 (2002): 1033-1038. Available at http://opticalengineering.spiedigitallibrary.org/article.aspx?articleid=1098876
[Sabatke2001] D. Sabatke et al, "Snapshot imaging spectropolarimeter." Optical engineering 41.5 (2002): 1048-1054. Available at http://opticalengineering.spiedigitallibrary.org/article.aspx?articleid=1098879
[Tufte2001] E. Tufte, "The Visual Display of Quantitative Information." Cheshire, Connecticut: GraphicPressLLC (2001).
[Jie2011] L. Jie et al. "Design and performance of a compact miniature static Fourier transform imaging spectropolarimeter." International Symposium on Photoelectronic Detection and Imaging 2011. International Society for Optics and Photonics, 2011. Available at http://proceedings.spiedigitallibrary.org/proceeding.aspx?articleid=1343610
[Voors2010] R. Voors et al. "SPEX: the spectropolarimeter for planetary exploration." SPIE Astronomical Telescopes and Instrumentation: Observational Frontiers of Astronomy for the New Decade. International Society for Optics and Photonics, 2010. Available at http://proceedings.spiedigitallibrary.org/proceeding.aspx?articleid=749932
[Ebbesen2008] Ebbesen et al, "Plasmonic photon sorters for spectral and polarimetric imaging." Nature Photonics 2.3 (2008): 161-164. Available at http://www.nature.com/nphoton/journal/v2/n3/abs/nphoton.2008.1.html
[Xu2010] T. Xu et al, "Plasmonic nanoresonators for high-resolution colour filtering and spectral imaging." Nature Communications 1 (2010): 59. Available at http://www.nature.com/ncomms/journal/v1/n5/abs/ncomms1058.html
[Oka2011] K. Oka et al, "Channeled spectropolarimeter using a wavelength-scanning laser and a channeled spectroscopic polarization state generator." SPIE Optical Engineering+ Applications. International Society for Optics and Photonics, 2011. Available at http://proceedings.spiedigitallibrary.org/proceeding.aspx?articleid=1268838
[Kebabian2004] P. Kebabian et al, "Realization of quantitative-grade fieldable snapshot imaging spectropolarimeter." Optics Express 12.26 (2004): 6559-6573. Available at http://www.opticsinfobase.org/oe/abstract.cfm?uri=oe-12-26-6559
[Tyo1999] J. Scott Tyo et al, "Imaging spectropolarimeters for use in visible and infrared remote sensing." SPIE's International Symposium on Optical Science, Engineering, and Instrumentation. International Society for Optics and Photonics, 1999. Available at http://proceedings.spiedigitallibrary.org/proceeding.aspx?articleid=994800
[Liua2012] Y. Liua et al, "Complementary Fluorescence-Polarization Microscopy using Division-of-Focal-Plane Polarization Imaging Sensor," Journal of Biomedical Optics, vol. 17(11), pp. 116001.1-116001.4, 2012. Available at http://www.ncbi.nlm.nih.gov/pubmed/23117796
FPA: Focal Plane Array
EM: Electromagnetic
DoT: Division of Time
DoFP: Division of Focal Plane
AoP: Angle of Polarization
DoLP: Degree of Linear Polarization
DoP: Degree of Polarization
LCTF: Liquid Crystal Tunable Filter
AOTF: Acousto-Optic Tunable Filter
PEM: Photo Elastic Modulator
CTICS: Computed Tomography Imaging Channeled Spectropolarimeter
CMOS: Complementary Metal Oxide Semiconductor
CCD: Charge Coupled Device
RMSE: Root Mean Squared Error
QE: Quantum Efficiency
SNR: Signal to Noise Ratio
nm: nanometer
ANOVA: Analysis of Variance